Research & Analysis
How the internals behave when you push on the knobs.
Canonical standard-dataset evidence, every leaf method, configuration ablations, CPU/RAM/disk timelines, scale studies, external comparisons, and publication positioning live here. The default docs contain only production architecture and guidance.
Read this first
Evidence classes stay separate
Current qualification is in progress. The exact-vector storage boundary changed to standard typed Arrow IPC record batches on 23 July 2026. Every earlier descriptor-v8 latency, CPU, RAM, disk, request, and cost row is therefore historical and cannot support the current defaults. Fresh empty-prefix runs will be promoted only after they satisfy the expanded DBpedia/Cohere/LAION/MS MARCO/filter/multitenant/hybrid/late-interaction matrix.
Full-corpus AWS results, controlled local method experiments, synthetic scale studies, direct external measurements, and vendor-reported context are never merged into one ranking. Every chart is backed by a checked-in CSV, and missing method/dataset cells remain explicitly unmeasured. The canonical reviewable index is docs/research/.
Canonical corpus
What has been evaluated
Historical corpus: Fashion-MNIST, GloVe, SIFT, NYTimes, GIST, and Deep-Image retain descriptor-v8 source recreations and archived curves for regression research. Current matrix: DBpedia OpenAI 1M, Cohere 1M/10M, LAION 100M, MS MARCO V2 138M, filters, multitenancy, BEIR hybrid, ColBERT late interaction, and mixed cache coverage are now required before publication.
Parquet versus Vortex
Corrected real-segment replay keeps Parquet as the default
The first Vortex latency comparison was invalid because it stopped before materializing compressed Vortex arrays to the Arrow values consumed downstream. The corrected AWS replay covers all 17 normal-segment objects from a real Fashion-MNIST-784 index, with 3 warmups and 30 measured repetitions for every object, format, and workload. All 7,650 timed rows use the same materialized_arrow boundary.
Vortex coalesced selective native-S3 scans and won projection, point, range, and filter workloads in that historical reader. Parquet won full materialization and was much smaller: 96.84 MiB versus 253.78 MiB for Vortex default and 319.56 MiB for compact. That selective advantage was not the production query path, and the later frozen object-role qualifications rejected promotion. The unreleased backend and its dependency graph have since been removed; this section remains revision-bound research evidence.
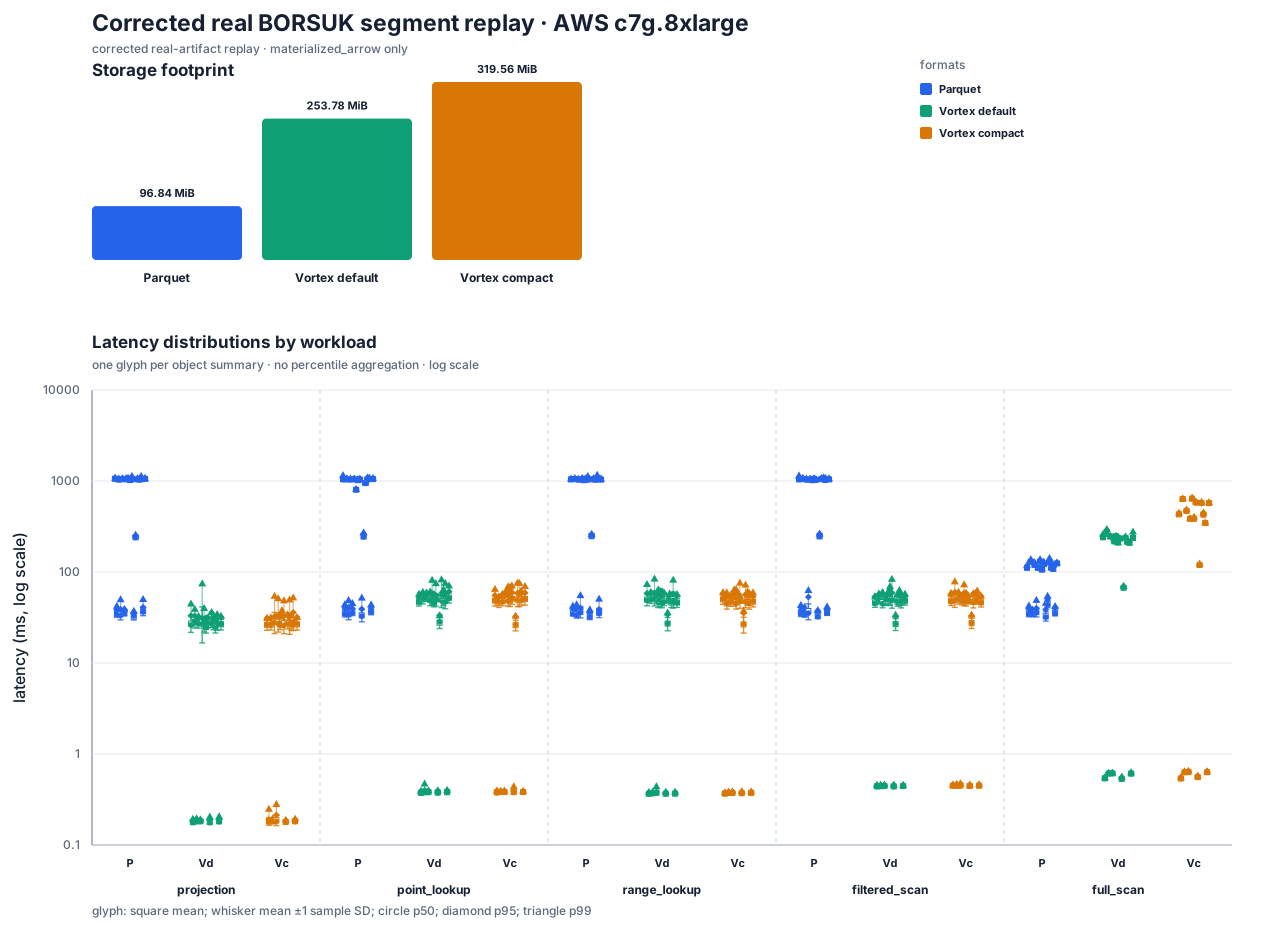
The aggregate CSVs and full methodology live in the table-format A/B report. Vortex compact is not a default candidate on this schema: it is 3.30× the Parquet footprint and its pooled full-scan p95 is 637.8 ms versus 129.8 ms for Parquet.
Public ANN corpora
Archived pre-Arrow-sidecar results
Every table row in this section predates the standard typed Arrow IPC sidecar and is historical. It remains visible for auditability, but none is a current production/default claim. The replacement runs report startup separately from uncached, zero-backing-GET disk-cached, and 0/25/50/75/100% mixed-coverage p50/p95/p99/mean/stddev.
Guarantee boundary: production pq-scan reports empirical recall on each complete query set. Exact/guaranteed_recall is the formal 1.0 path and remains RAM-bounded, but it may read and score the full eligible corpus when safe lower bounds cannot prune. The NYTimes control measured 405.6 MB/query and 5.19 s disk-cached p95 for exact search; an empirical 1.000 ANN result is never relabelled as guaranteed.
| Dataset | recall@10 | uncached p95 | disk-cached p95 | peak RSS |
|---|---|---|---|---|
| Fashion-MNIST · descriptor-v6 first pass | 0.988 | 178.2 ms | 1.40 ms | 276 MiB build+sweep |
| Fashion-MNIST · descriptor-v8 packed default · 3-run median | 0.989 | 197.9 ms | 1.667 ms | 75.0 MiB worst serving |
| GloVe · descriptor-v7 adaptive rebuild | 0.985 | 495.1 ms | 13.3 ms | 350 MiB build+sweep |
| NYTimes · descriptor-v7 adaptive rebuild | 0.958 | 701.8 ms | 9.3 ms | 262 MiB build+sweep |
| GloVe · descriptor-v8 packed rebuild | 1.000* | 448.5 ms | 25.0 ms | 360 MiB build+sweep |
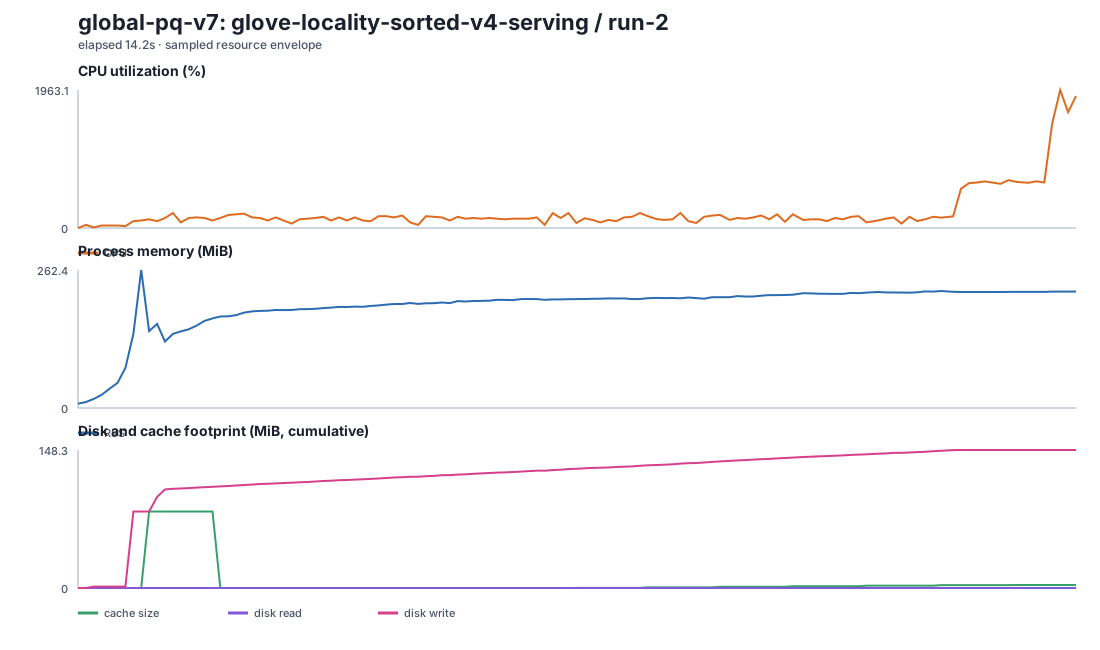
| GloVe · descriptor-v8 packed default · 3-run median | 1.000* | 467.3 ms | 25.0 ms | 148.8 MiB worst serving |
| NYTimes · descriptor-v8 packed rebuild | 0.958 | 312.5 ms | 12.3 ms | 280 MiB build+sweep |
| NYTimes · descriptor-v8 code128 default · 3-run median | 0.993 | 368.9 ms | 19.7 ms | 118.9 MiB worst serving |
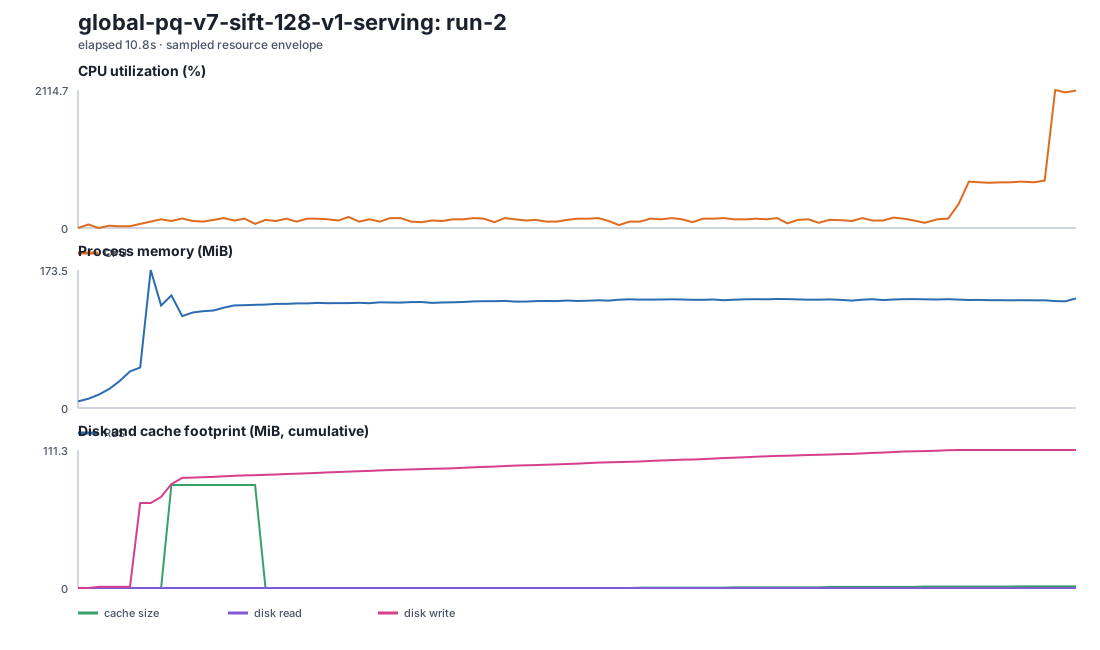
| SIFT · descriptor-v8 packed default · 3-run median | 0.997 | 213.8 ms | 4.58 ms | 104.9 MiB worst serving |
| GIST · descriptor-v8 code256 default · 3-run median | 0.995 | 427.3 ms | 29.2 ms | 304.3 MiB worst serving |
| Deep-Image · descriptor-v8 default · 3-run median | 0.990 | 508.2 ms | 26.0 ms | 271.9 MiB worst serving |
| Deep-Image · descriptor-v8 hierarchy balanced | 0.987 | 403.2 ms | 21.1 ms | 461 MiB build+sweep |
| Deep-Image · descriptor-v8 hierarchy high recall | 0.998 | 889.0 ms | 57.0 ms | 461 MiB build+sweep |
| Fashion-MNIST · historical pre-fixed-page v8 | 0.989 | 191.1 ms | 2.45 ms | 229 MiB median |
| Fashion-MNIST · historical v7 global PQ | 0.972 | 64.9 ms | 2.49 ms | 99.2 MiB |
| GloVe · historical v7 global PQ | 0.956 | 93.5 ms | 7.08 ms | 262 MiB |
| SIFT · historical v7 global PQ | 0.976 | 66.1 ms | 5.41 ms | 240 MiB |
| NYTimes · historical v6 | 0.959 | 477.3 ms | 78.3 ms | 759 MiB |
| GIST · historical v6 | 0.967 | 543.7 ms | 75.2 ms | 724 MiB |
| Deep-Image · historical v6 | 0.956 | 368.0 ms | 45.7 ms | 712 MiB |
These rows use the intended cache definitions but the superseded physical format. The old Deep-Image 41.9/44.6/46.4 ms row was disk-cached p50/p95/p99, not an S3-uncached result.
Quality versus time
Recall/latency curves for every production corpus
Each point changes nprobe while keeping the dataset and engine fixed. Higher recall usually requires more cells, bytes, GETs, and exact rerank work; the selected production point is the lowest tested configuration at or above recall 0.95, not the fastest point at arbitrary quality.
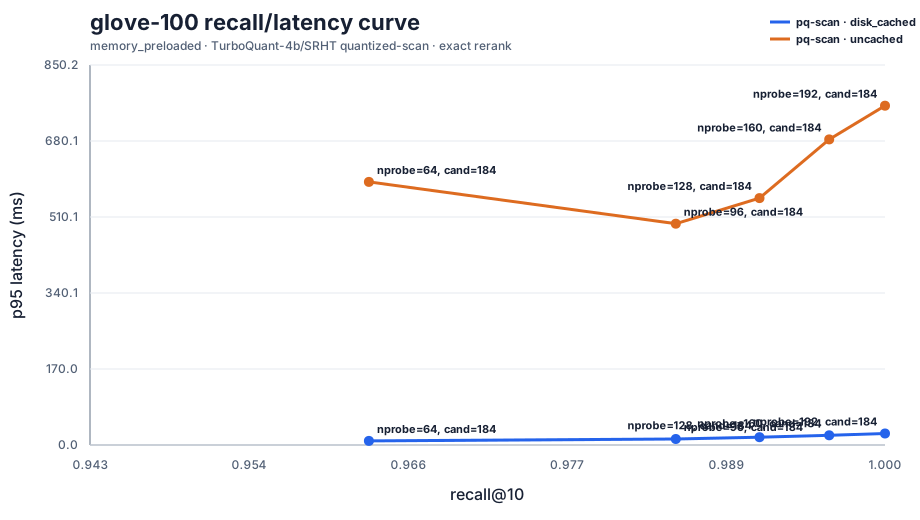
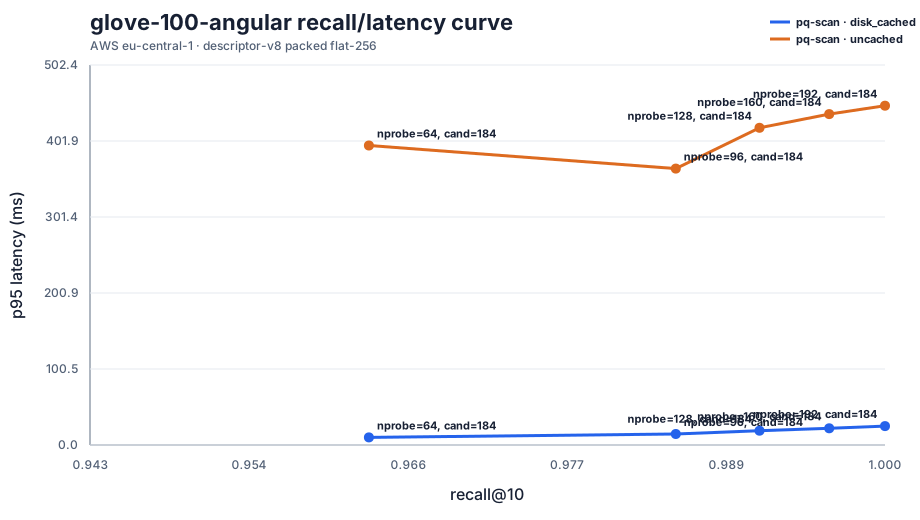
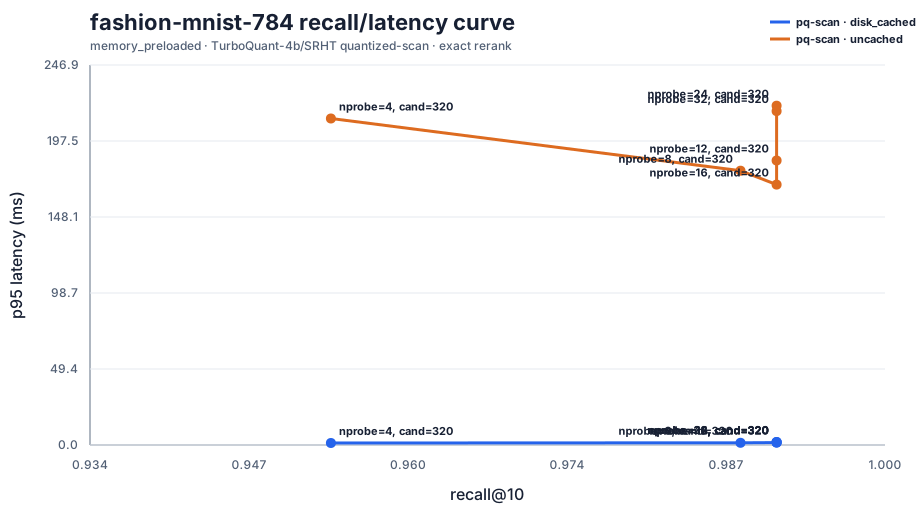
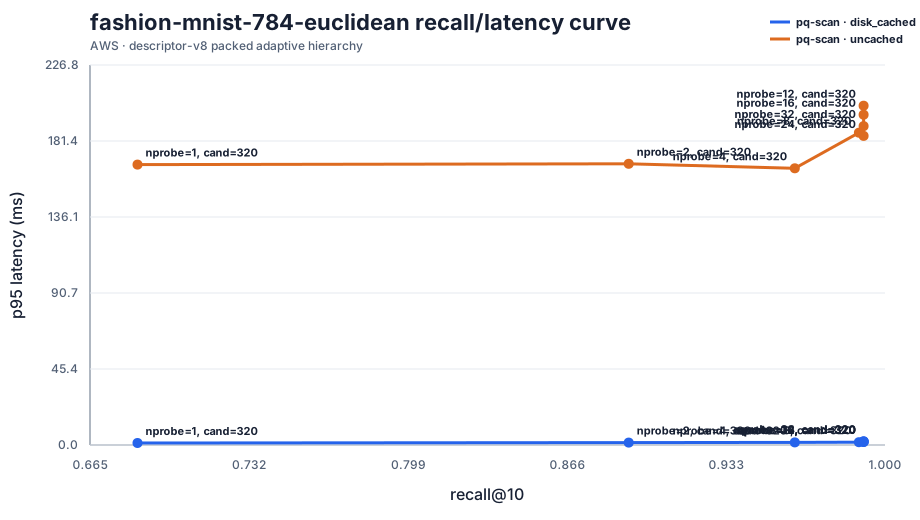
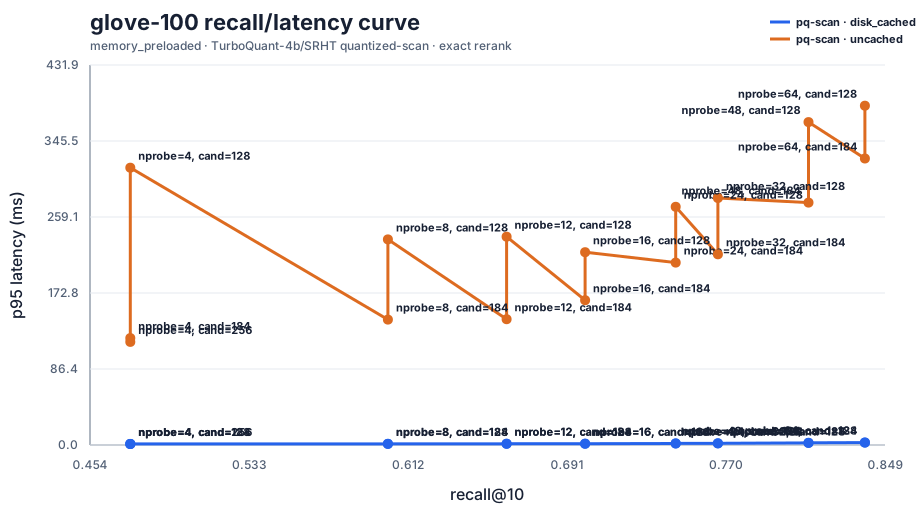
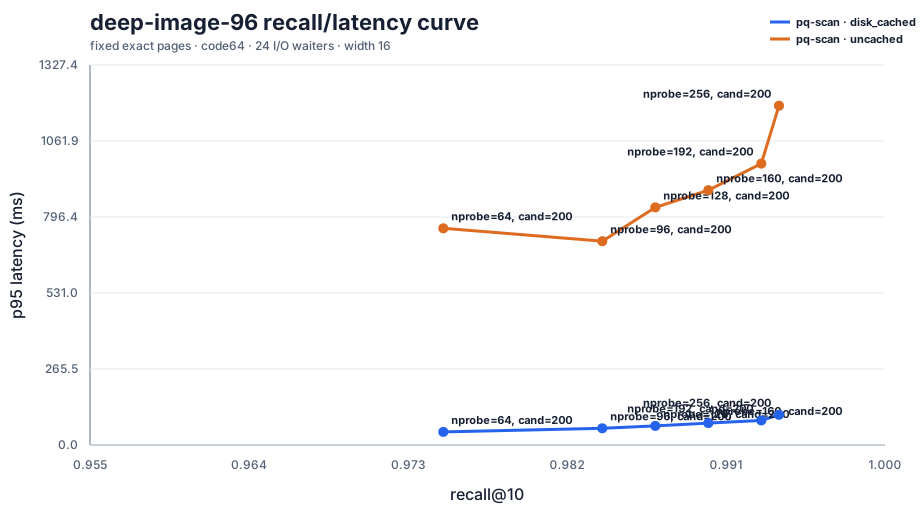
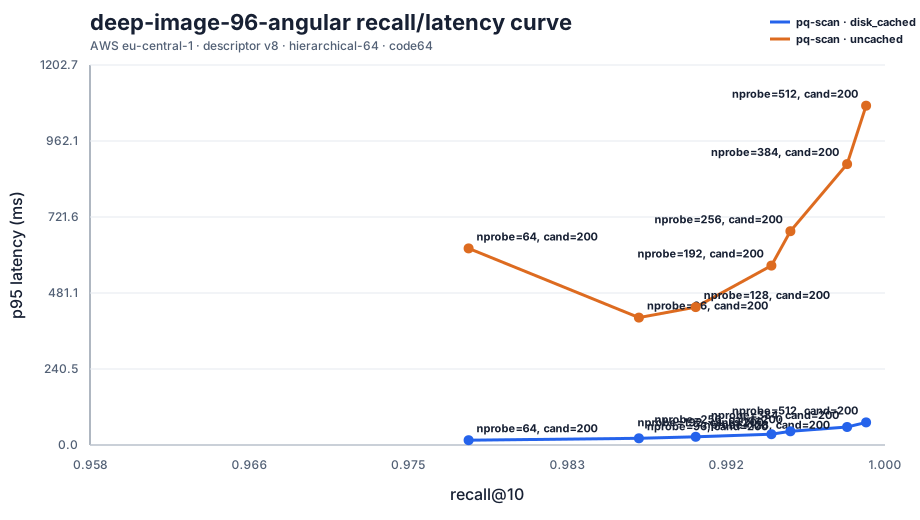
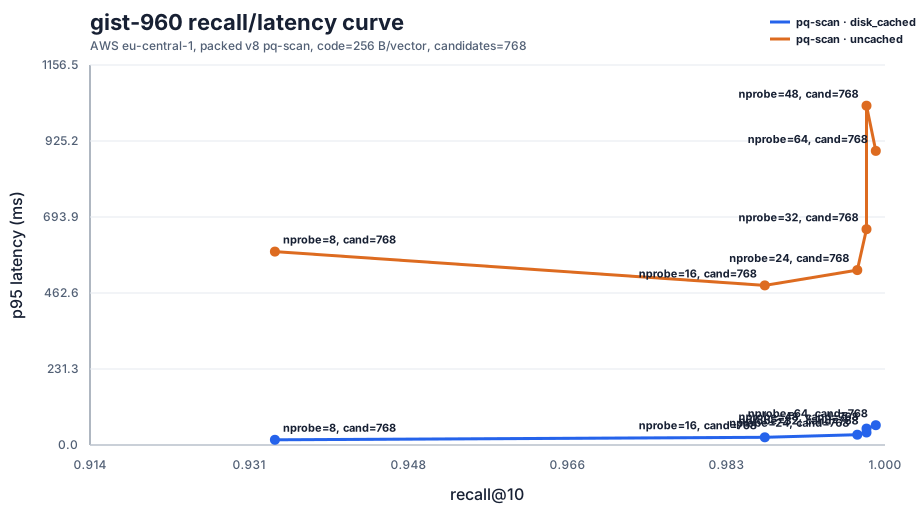
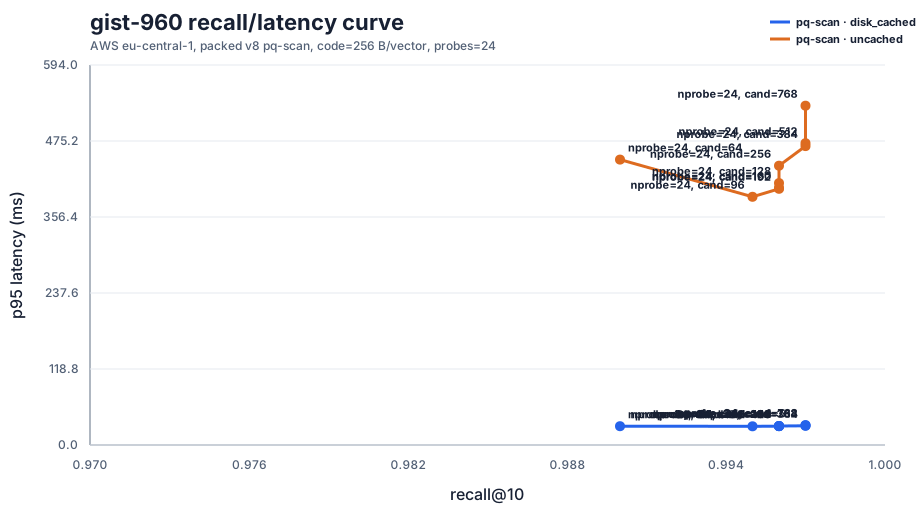
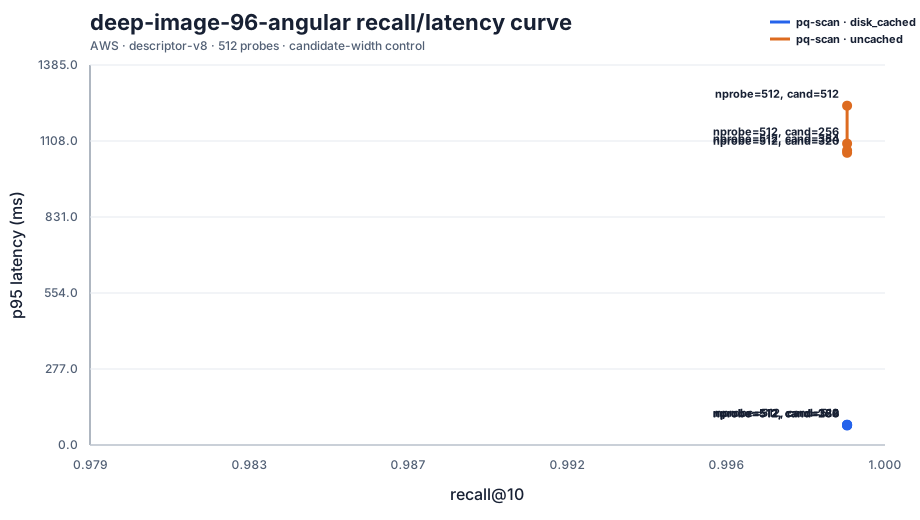
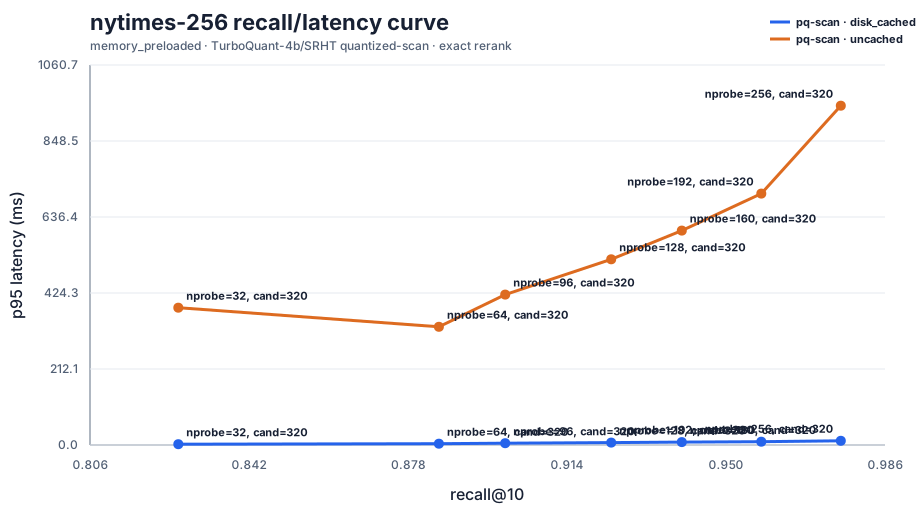
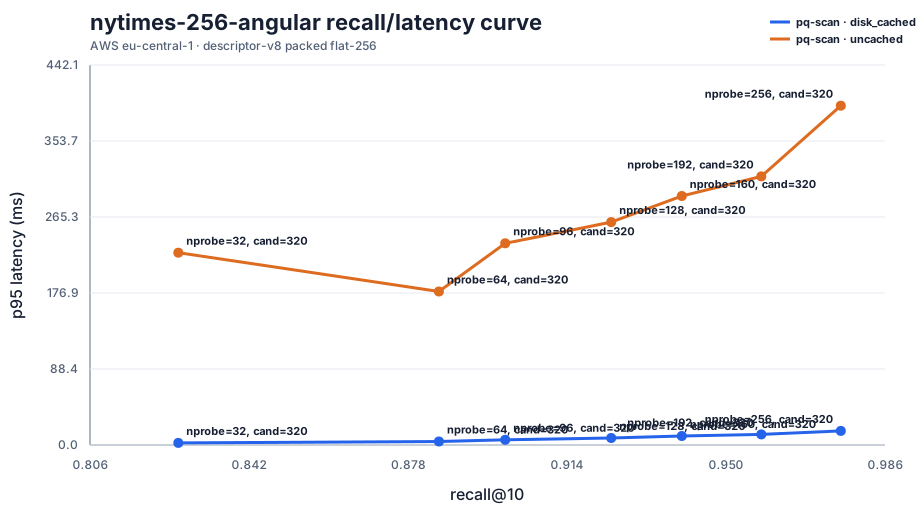
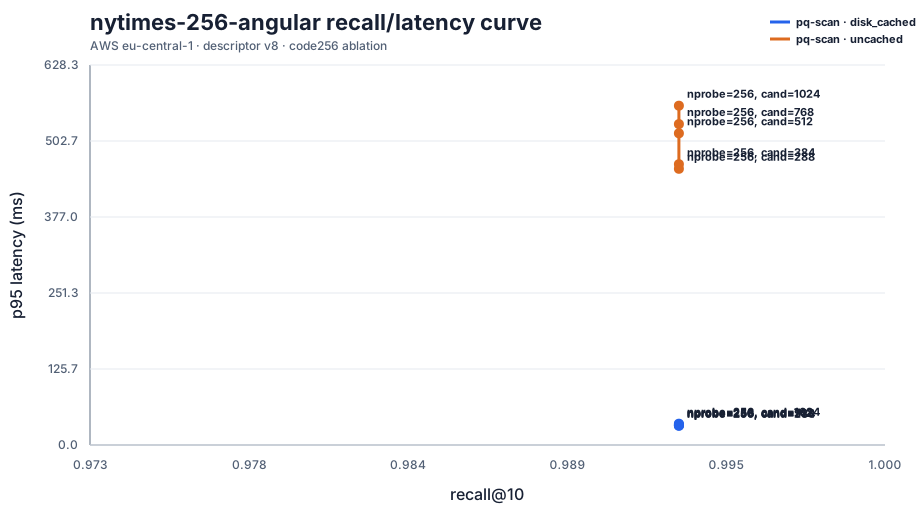
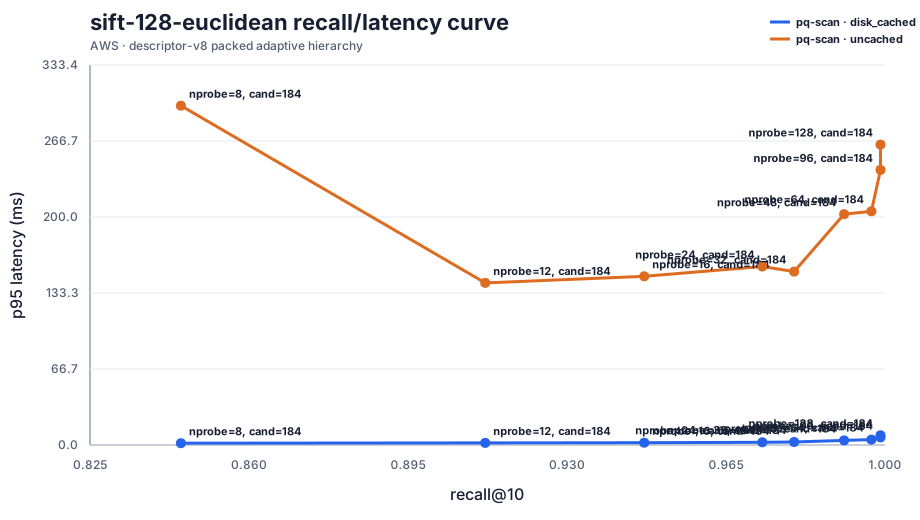
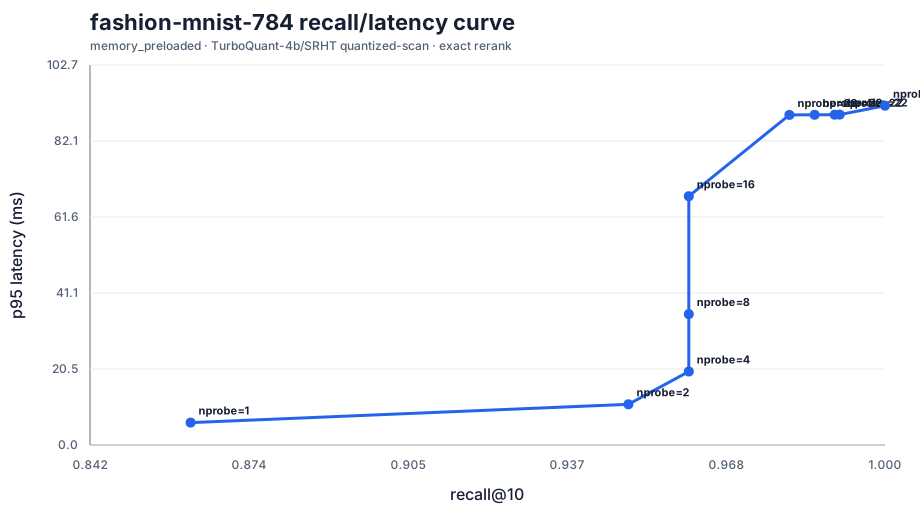
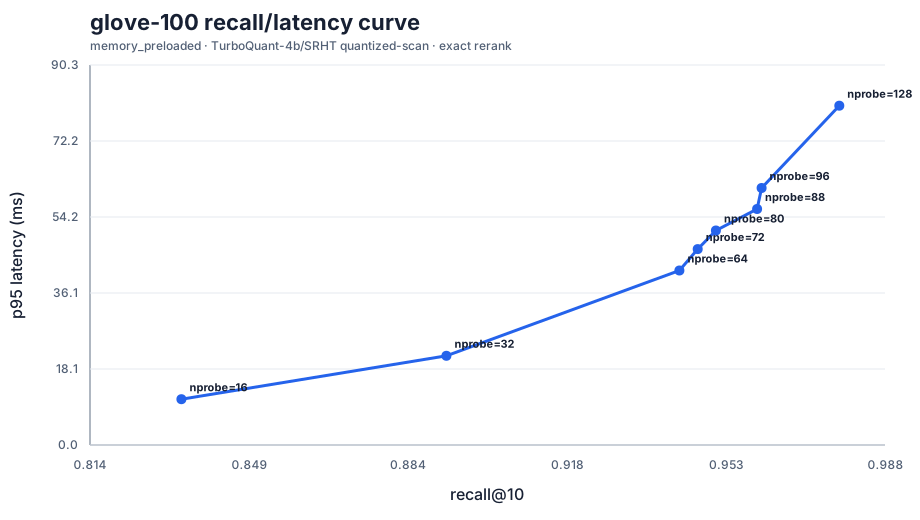
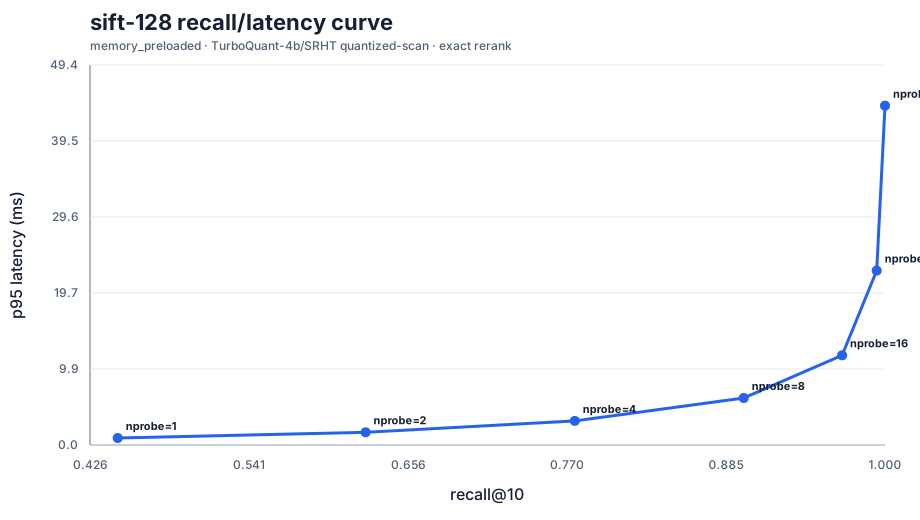
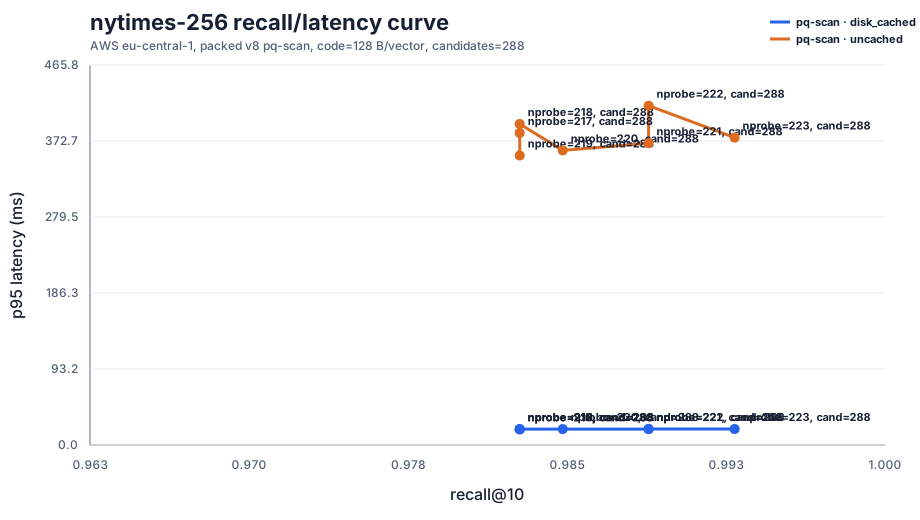
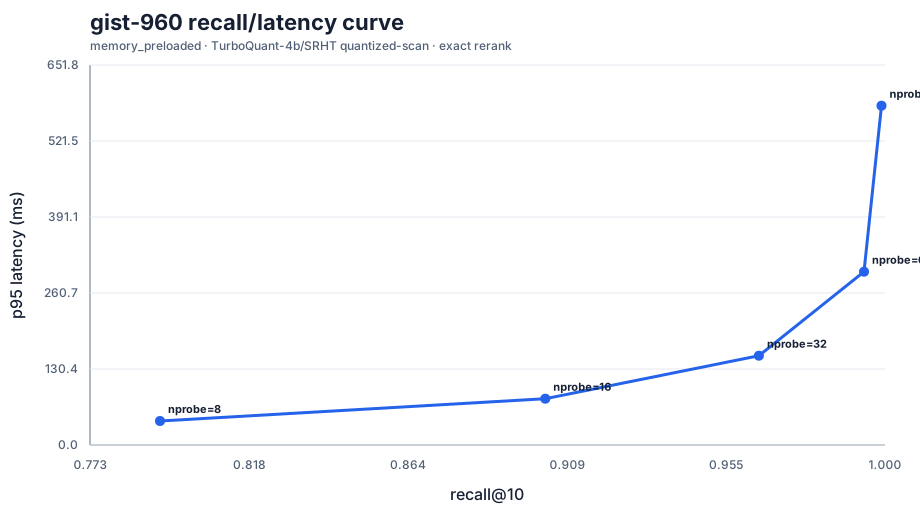
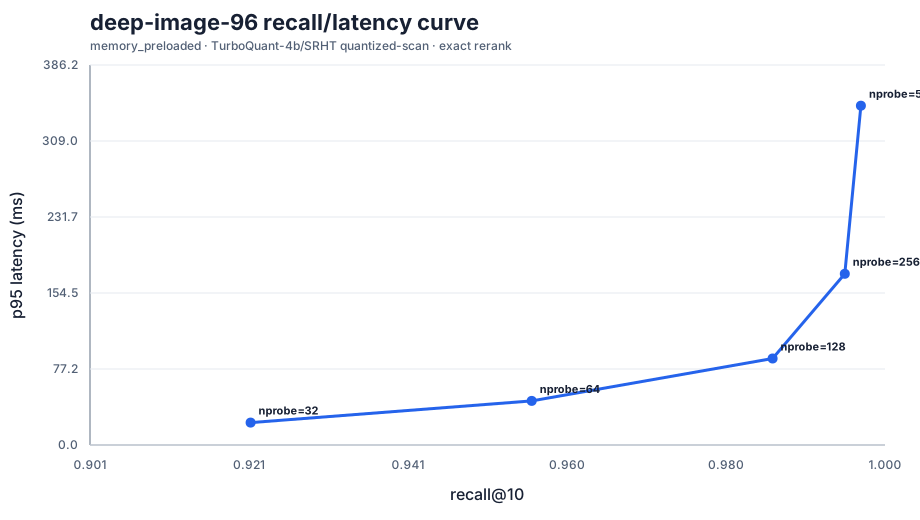
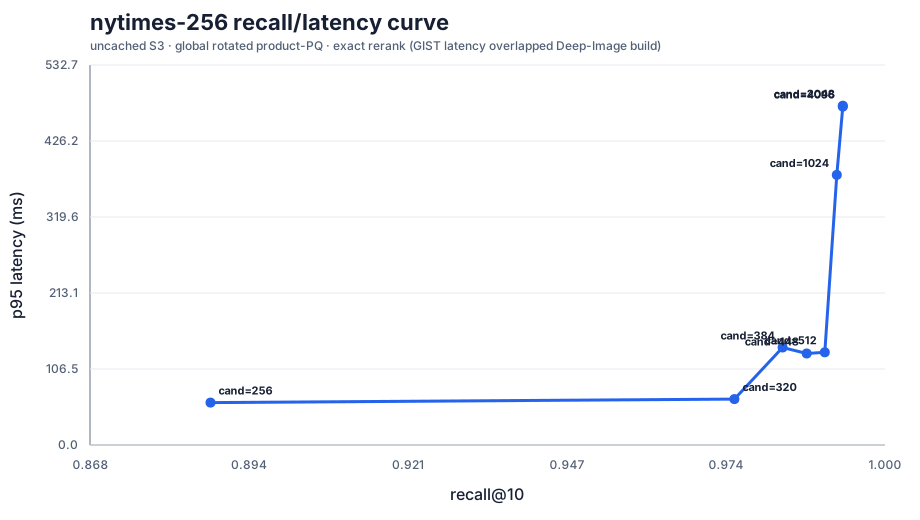
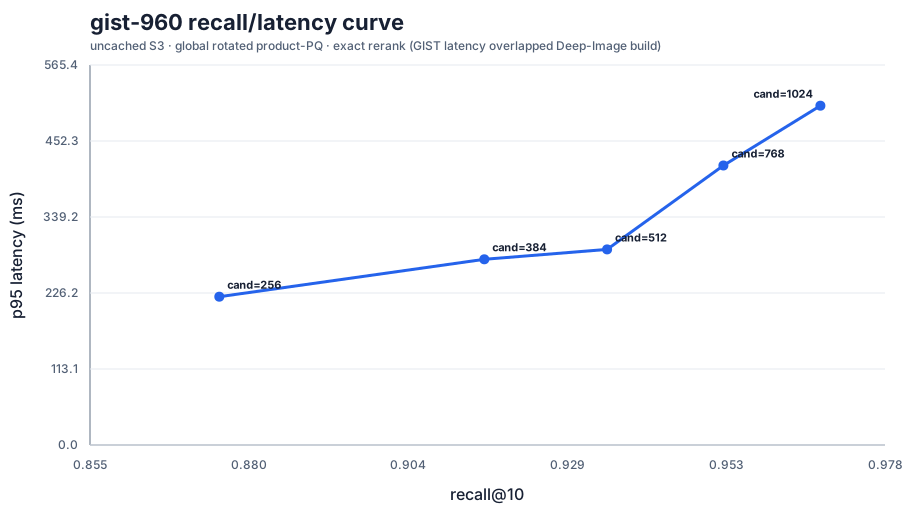
The packed descriptor-v8 Deep-Image recreation closes the large-angular routing question. The full-dimensional hierarchy reaches 0.987 recall at 96 probes with 403/21 ms uncached/disk-cached p95, 0.994 at 192 with 568/34 ms, and 0.998 at 384 with 889/57 ms. The 512 point reaches 0.999 but crosses 1.07 s and 126 MB/query. Holding 512 probes and widening exact candidates from 256 to 512 does not change recall; it raises uncached p95 from 1.10 to 1.24 s and GETs from 344 to 393. Build plus sweep peaks at about 461 MiB RSS and 4.20 GiB scratch, which is deleted after publication. The older product router needed 983 ms to reach only 0.993, so product routing remains a rejected ablation and large normalized corpora now use the bounded full-dimensional hierarchy. Exact mode remains the only formal 1.0 guarantee.
Experimental graph path
From 1.95 seconds to 28 milliseconds at unchanged recall
On the same graph-enabled Fashion-MNIST index and all 100 queries, a score-once best-first frontier reduced graph p95 from 1,951.5 to 208.8 ms. Sharing the immutable decoded/validated graph in the byte-accounted cell cache reduced it to 28.5 ms. Moving graph preparation into warm() removed the first-query metadata tail: 28.0 ms p95, 28.5 ms p99, zero measured-query GETs, and the same 0.970 recall at width 512.
The recall-matched point is wider: nprobe=32, 2,560 candidates/cell reaches 0.986 recall. Across three fresh repetitions its p95 is 56.4–57.7 ms (mean 56.9), versus pq-scan at the same 0.986 recall and 89.2 ms, and Vamana-PQ at 0.988 recall and 96.2–96.4 ms. These are memory-preloaded experimental graph results on one corpus—not a replacement for the six-corpus graph-free production default.
| Method | Cells / candidates | Recall@10 | p95 | Worst RSS | Query GETs |
|---|---|---|---|---|---|
| graph | 32 / 2,560 | 0.986 | 56.4–57.7 ms | 378.5 MiB | 0 |
| pq-scan | 22 / 12 | 0.986 | 89.2 ms | 379.0 MiB | 0 |
| Vamana-PQ | 22 / 32 | 0.988 | 96.2–96.4 ms | 379.0 MiB | 0 |
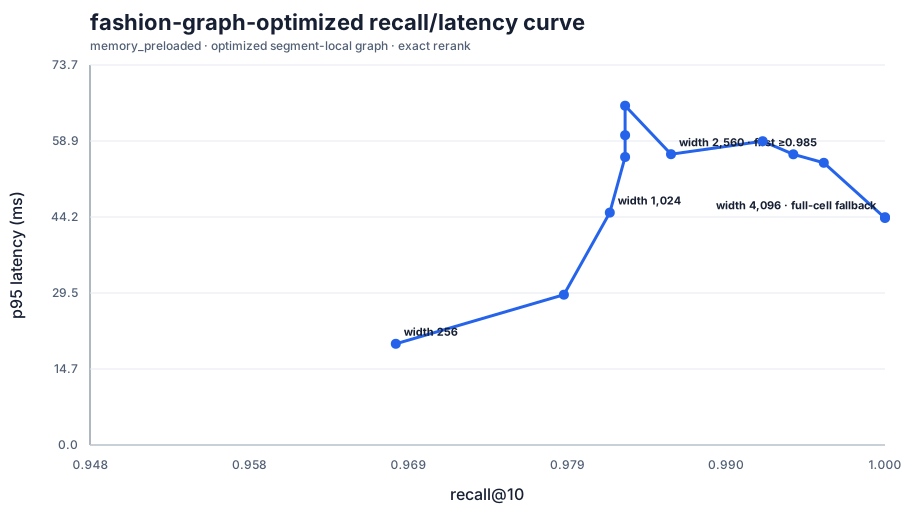
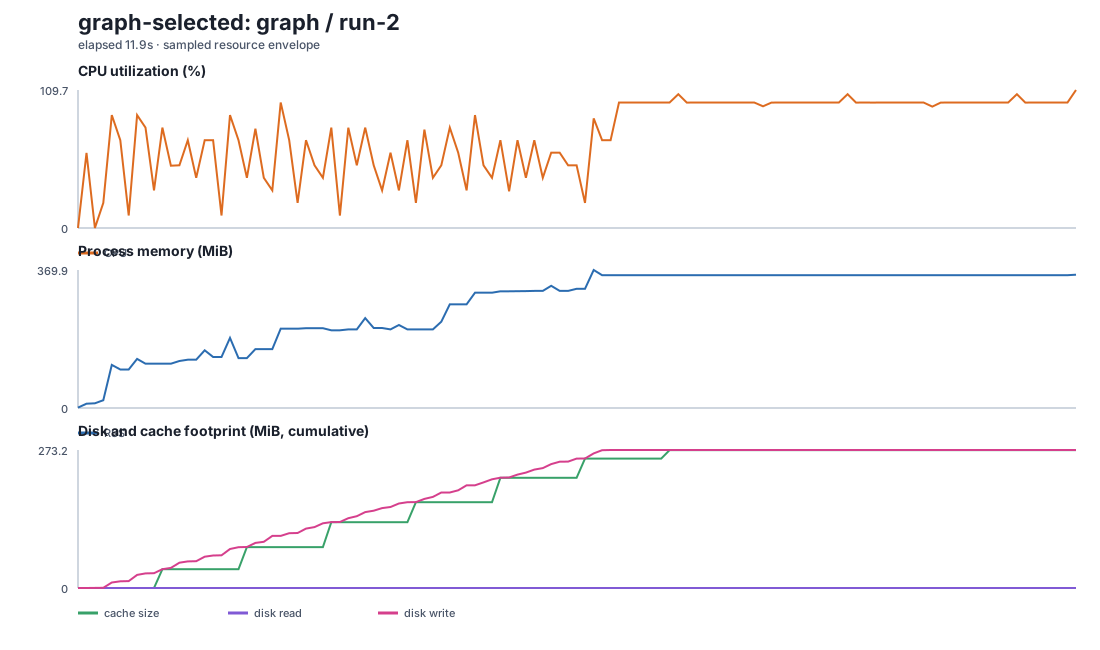
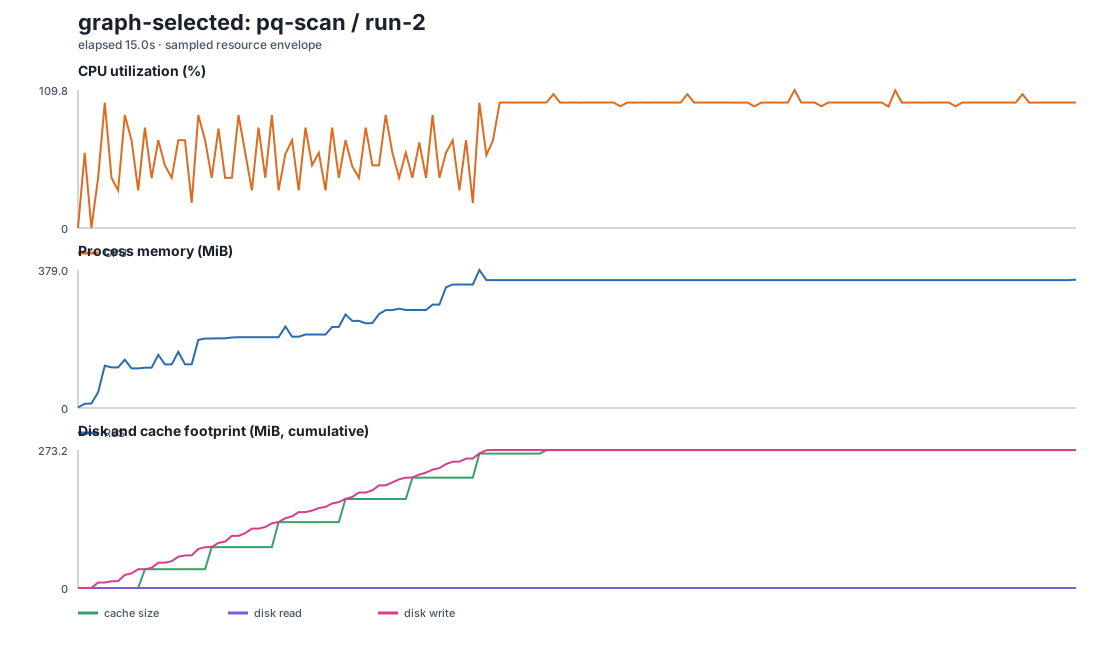
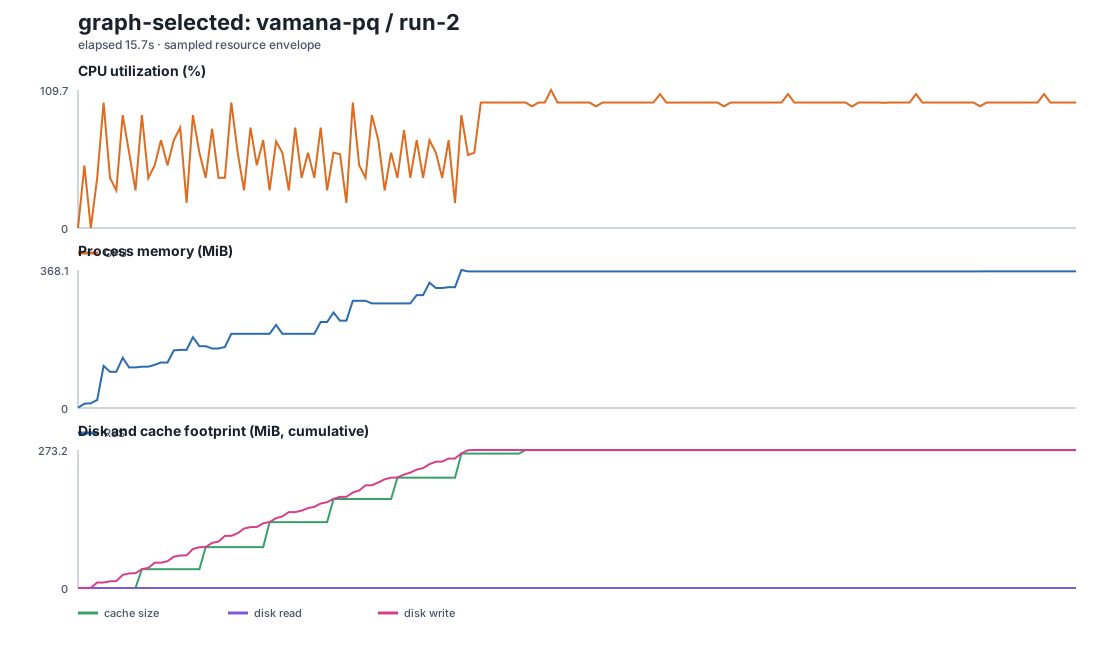
The full-coverage 4,096/8,192 candidate rows intentionally short-circuit graph traversal and exact-scan the routed cells, so their non-monotonic latency is labelled as a fallback. A prior 0.990/0.995 claim at widths 512/1,024 came from 20 profiling queries; the publication curve above uses all 100. Method, profile, and raw-artifact details →
Scale baseline · AWS eu-central-1
100M vectors stay memory-bounded; S3 latency is the next target
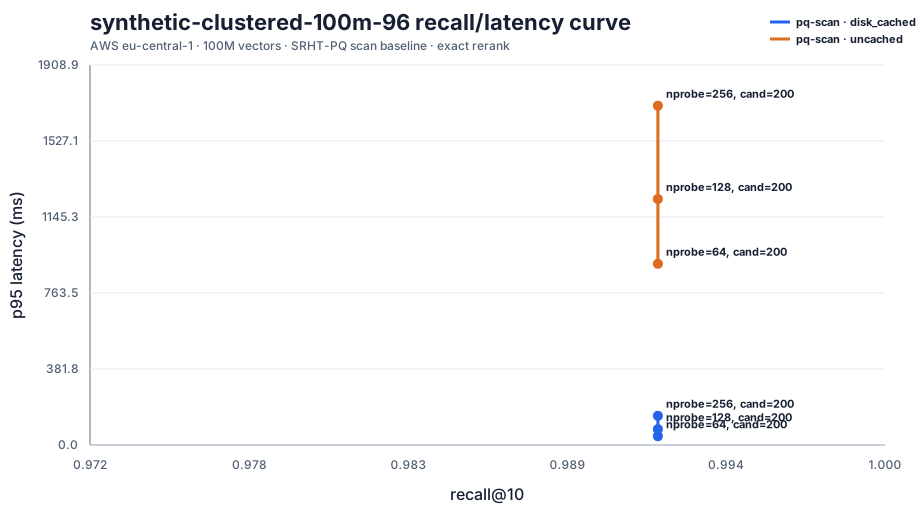
The first complete 100M×96D angular recreation reached 0.992 recall at 64 probes with 910.5 ms uncached and 44.4 ms disk-cached p95. Doubling probes to 128 and 256 did not change recall; it raised uncached p95 to 1.24/1.70 s and disk-cached p95 to 79/146 ms, so both rows are rejected.
The counters isolate the failure: 76.19 MB/query is the logical code span, while only 0.48 MB/query is additional uncached exact-rerank and final-record traffic. The v8 packed reader fetched from the first to the last selected slice in an object, including unrelated cells between them. A balanced 64-probe payload is about 26.56 MB before headers, so the measured span was 2.87× that lower bound. The v9 reader uses bounded, gap-aware ranges and never folds more than 64 KiB of unselected data into one code read; promotion waits for its fresh lower-probe AWS curve.
This historical result is not current evidence. The present pq-scan, srht-pq-scan, structured fast-turboquant-scan, and dense TurboQuant reference controls are rebuilt and labeled separately.
Cache-tier research · local synthetic control
Requested hot queries are not assumed to be cache hits
The cache benchmark records each query's requested class (hot or outside_hot_set) separately from its observed decoded-RAM, local-disk, and backing-storage access fractions. Shared cells and LRU eviction mean those are different facts: an outside query may reuse a hot cell, while a seeded query may miss after eviction.
On a fixed 100k-vector, 96D, 25-cell synthetic graph index, 128 MiB retained only 85% of accesses for the 100%-requested-hot mix and measured 117.3 ms steady p95. The smallest tested complete cap was 256 MiB: 100% decoded access, 0.285 ms steady p95, 1.831 ms p95 with 16 callers, and 227.3 MiB peak RSS. A 512 MiB cap did not improve that resident set. Queries outside the seeded set still paid a 112–129 ms p95 miss, so publication charts show all-query, hot-query, and outside-hot-set tails separately.
The matching auto control retained only 12/26 segment graphs at 64 MiB, reported coverage_complete=false, and served through srht-pq-scan without failing. At 256 MiB it retained 26/26, reported complete coverage, and selected the graph. These are local controls; the six-corpus AWS matrix must reproduce the envelope before any cache size becomes a default.
Whole-process telemetry
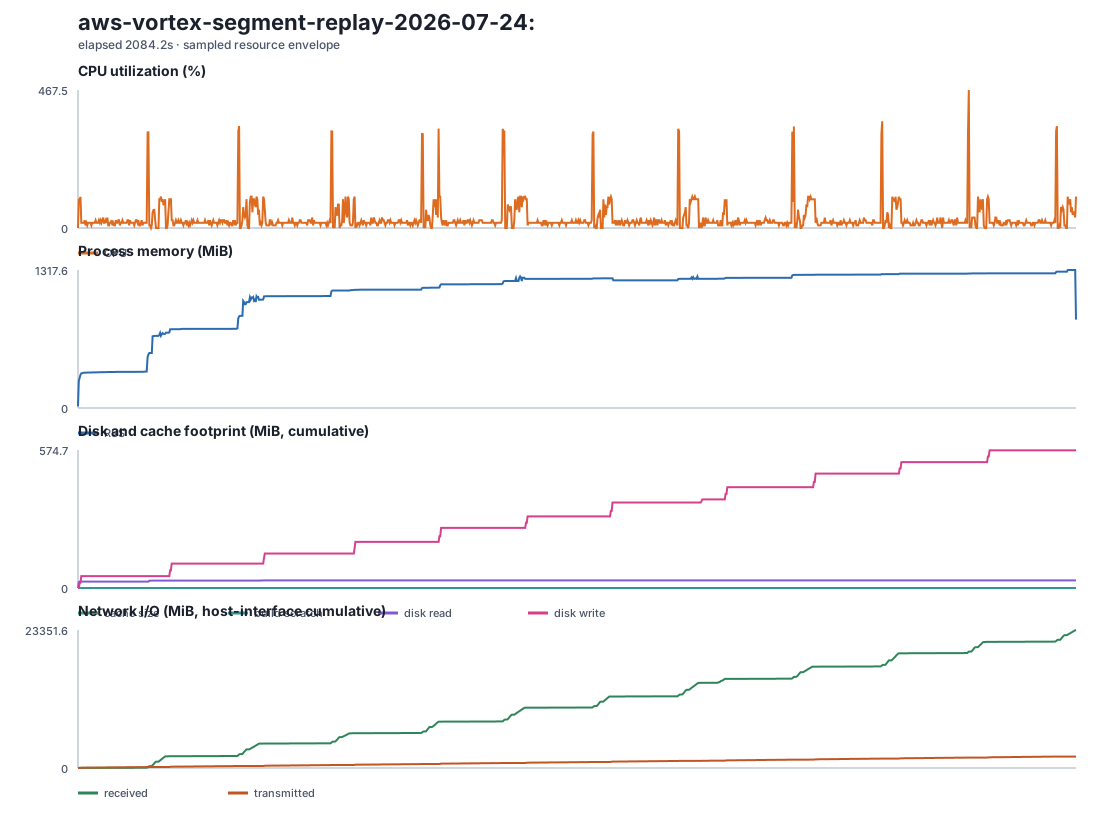
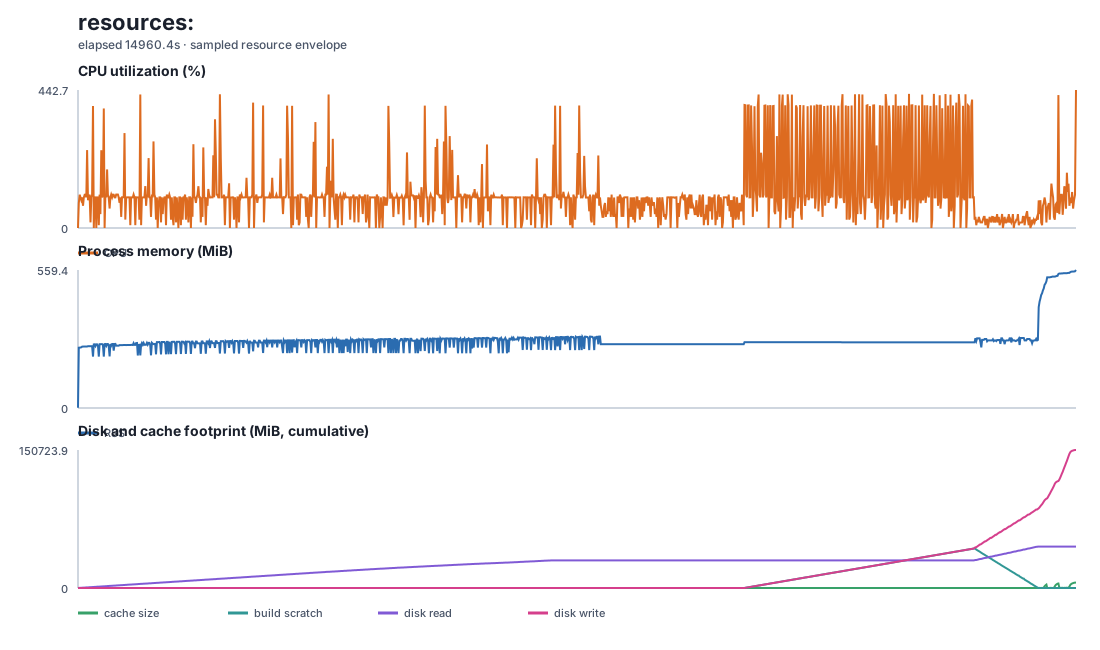
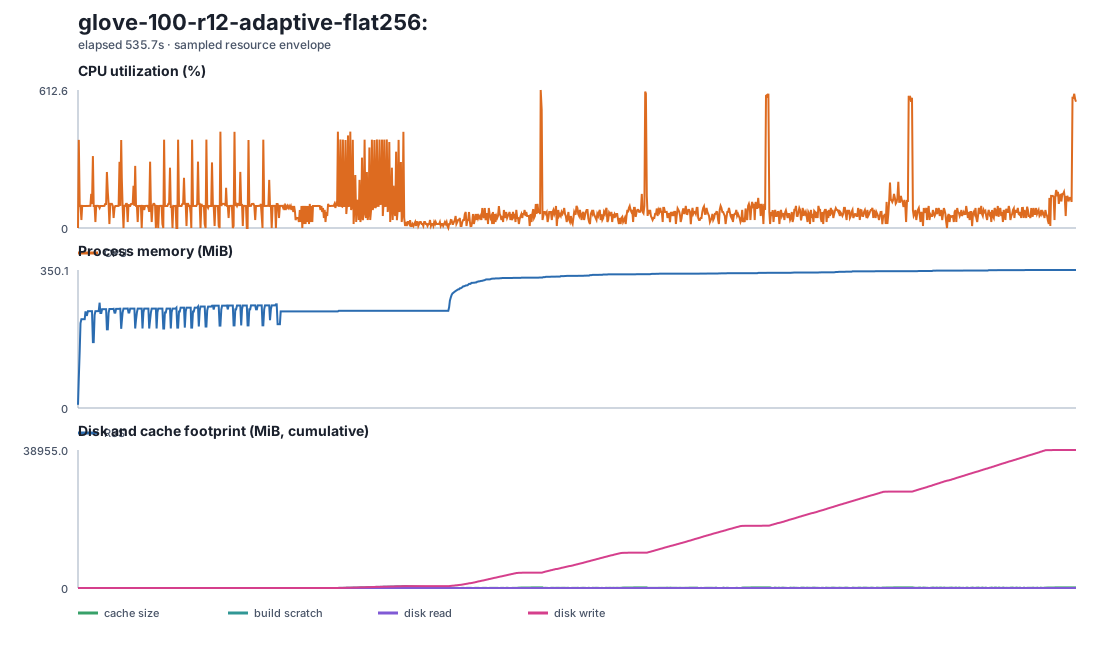
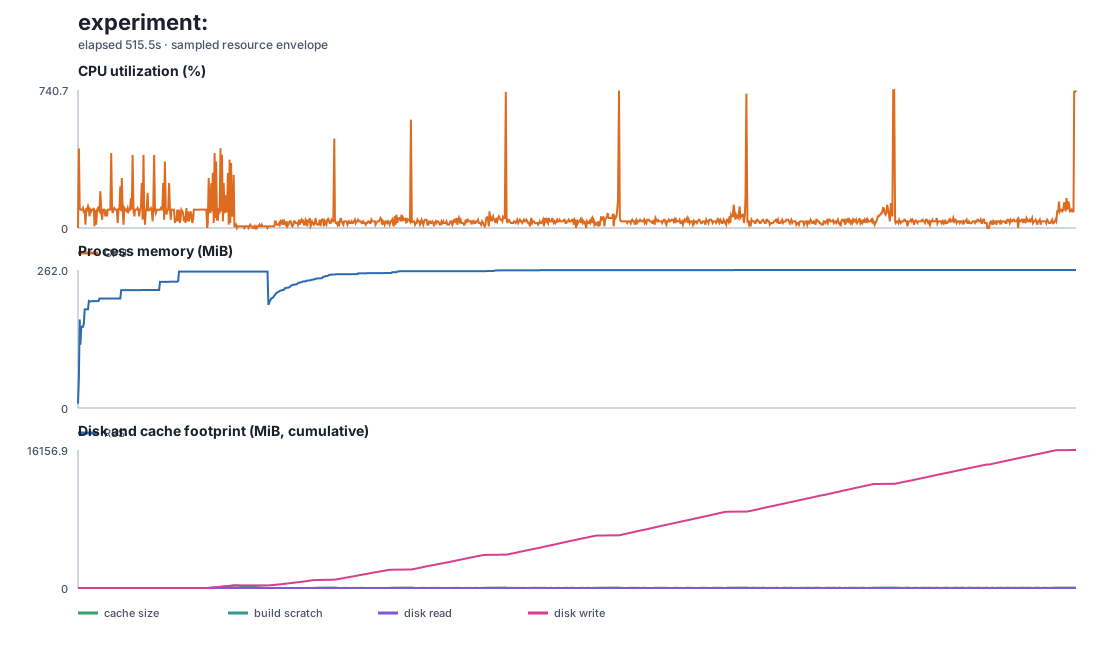
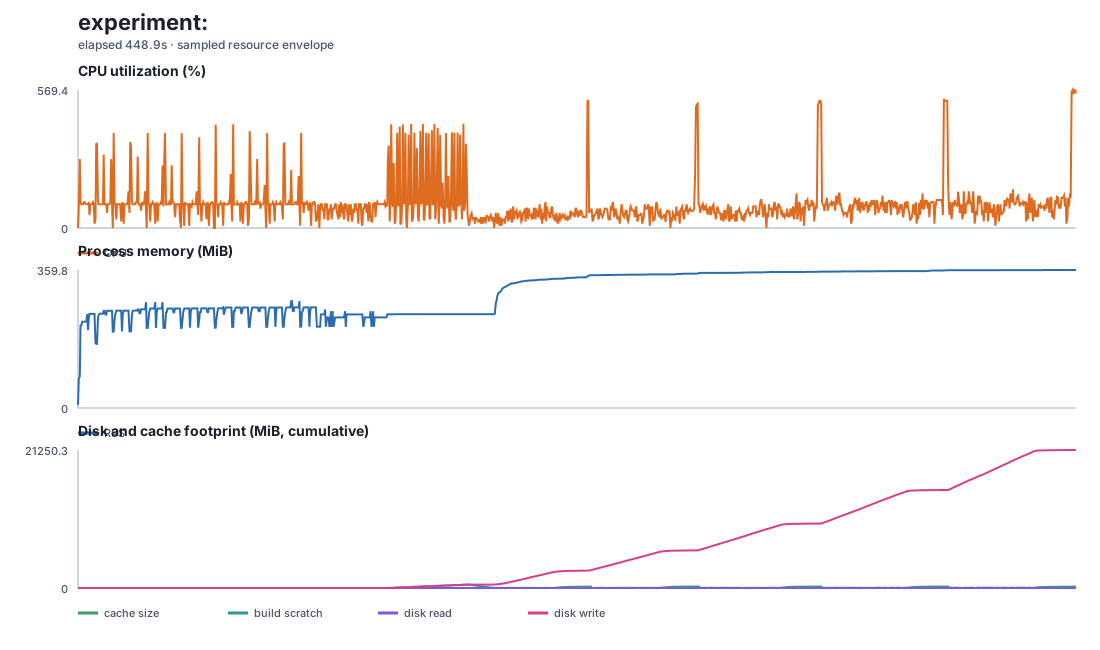
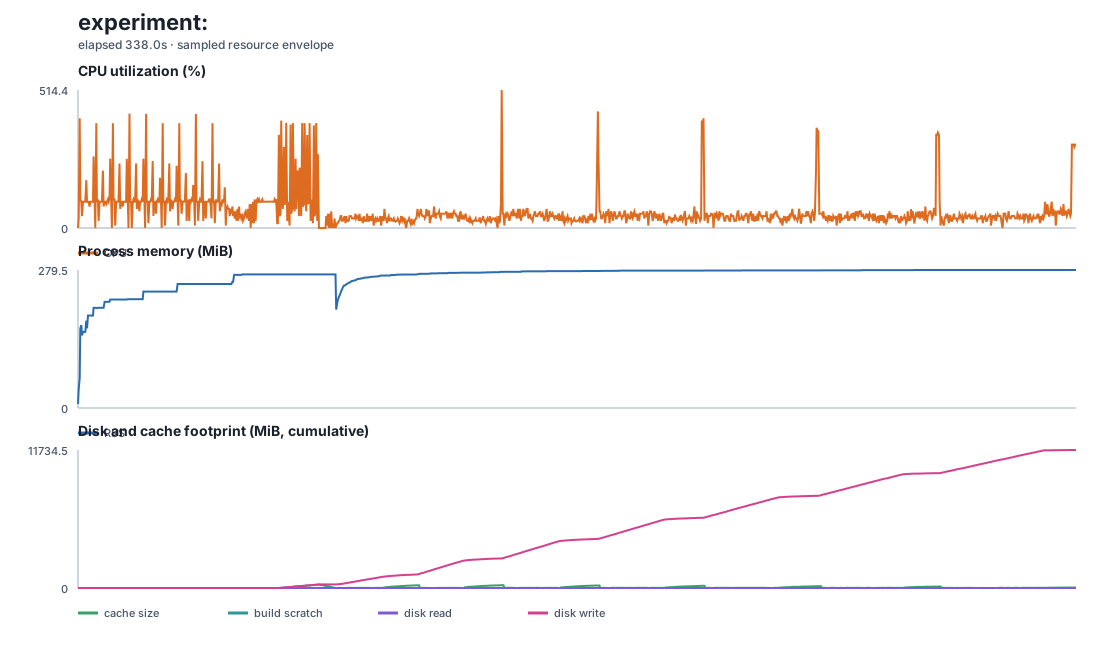
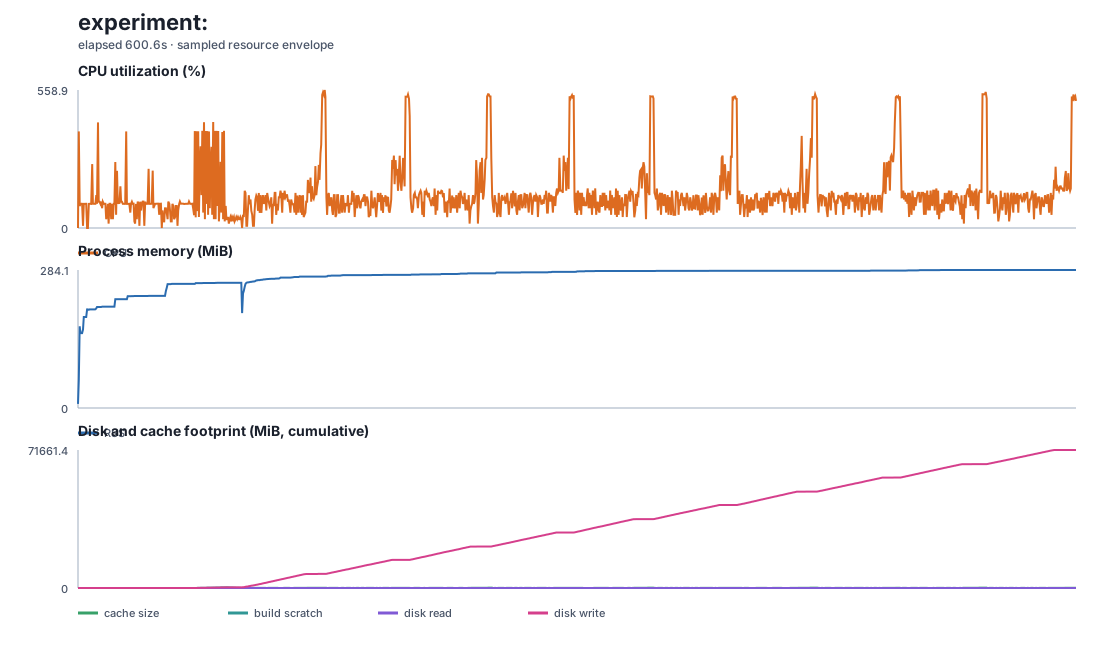
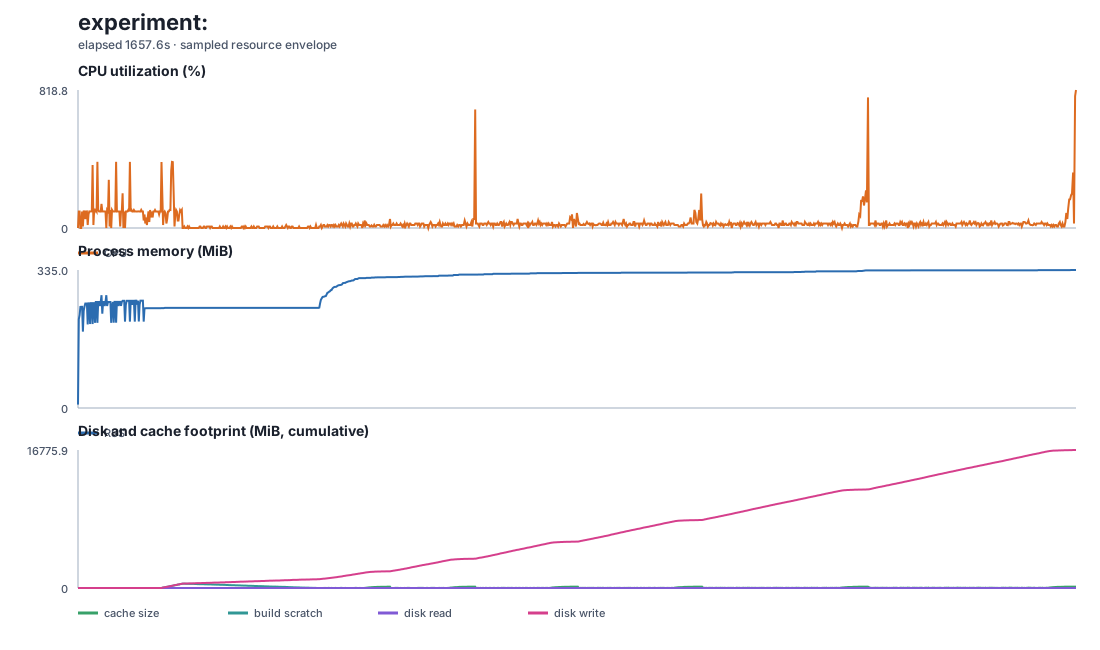
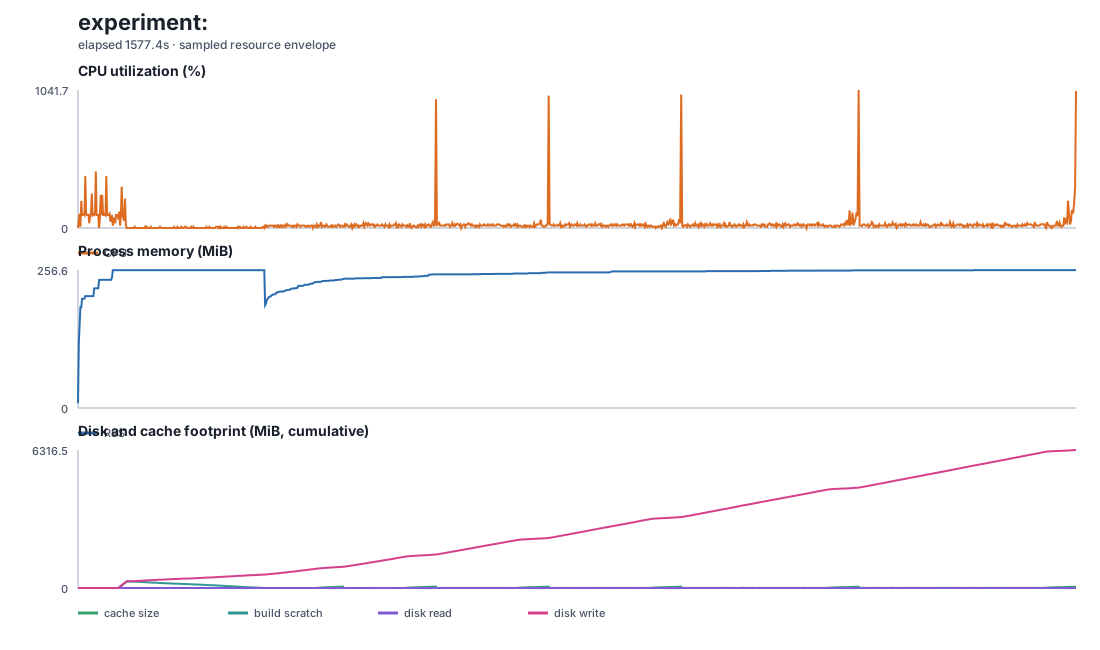
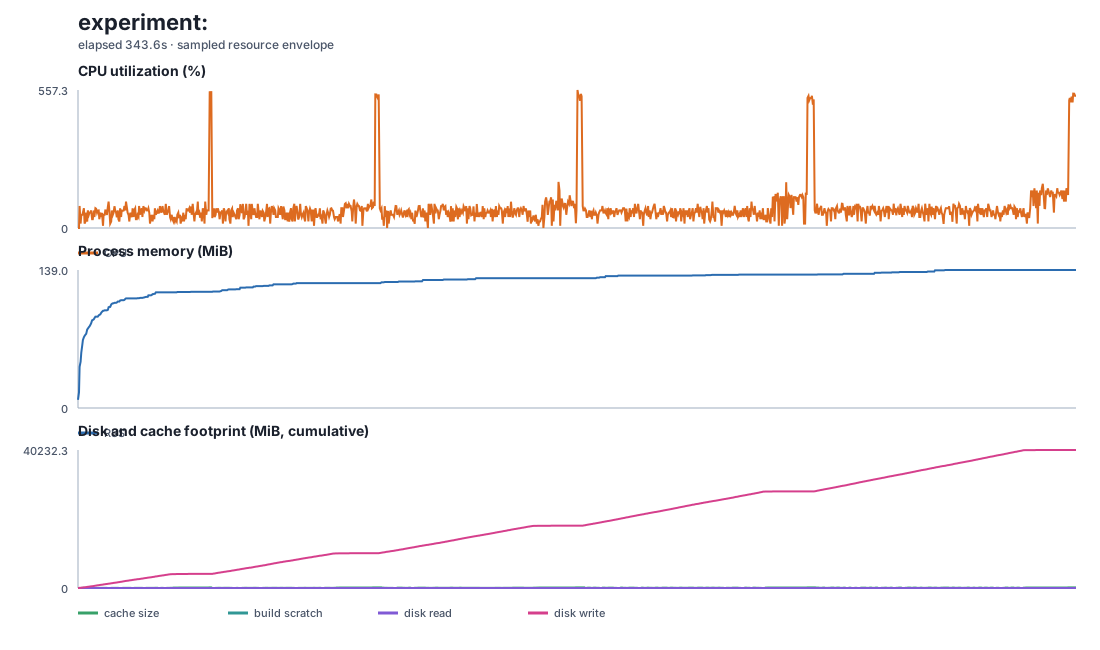
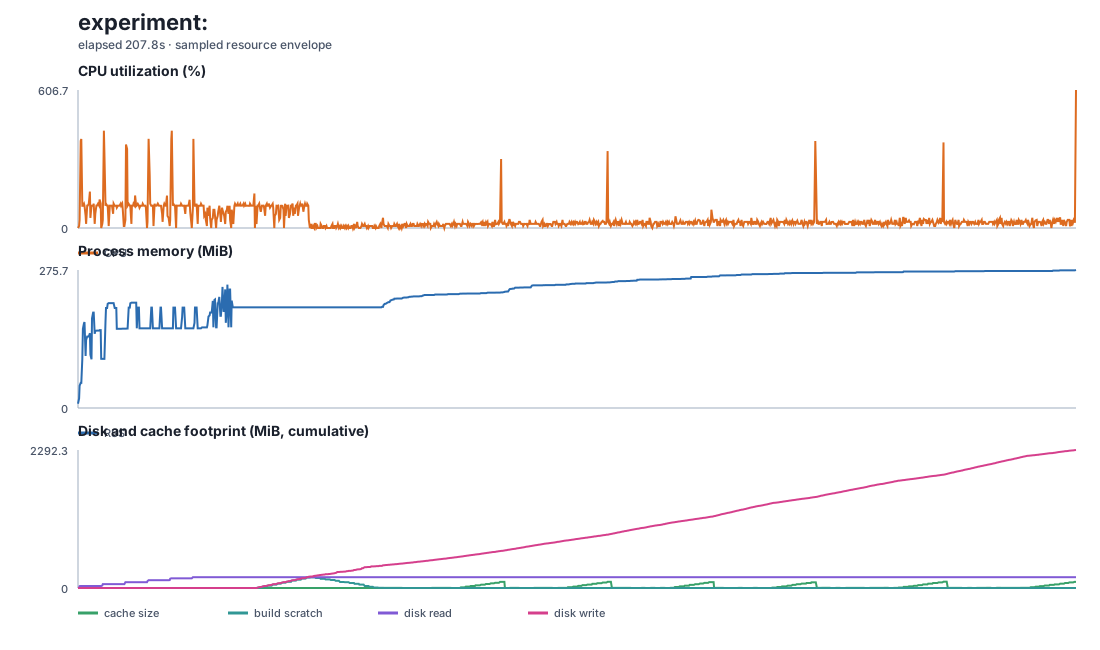
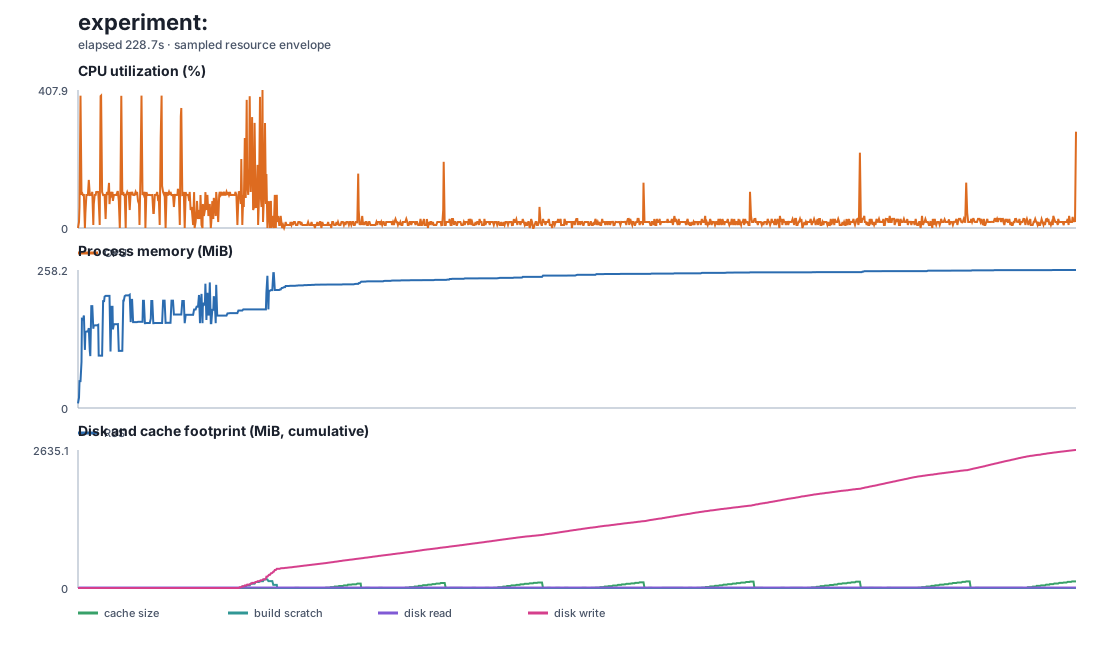
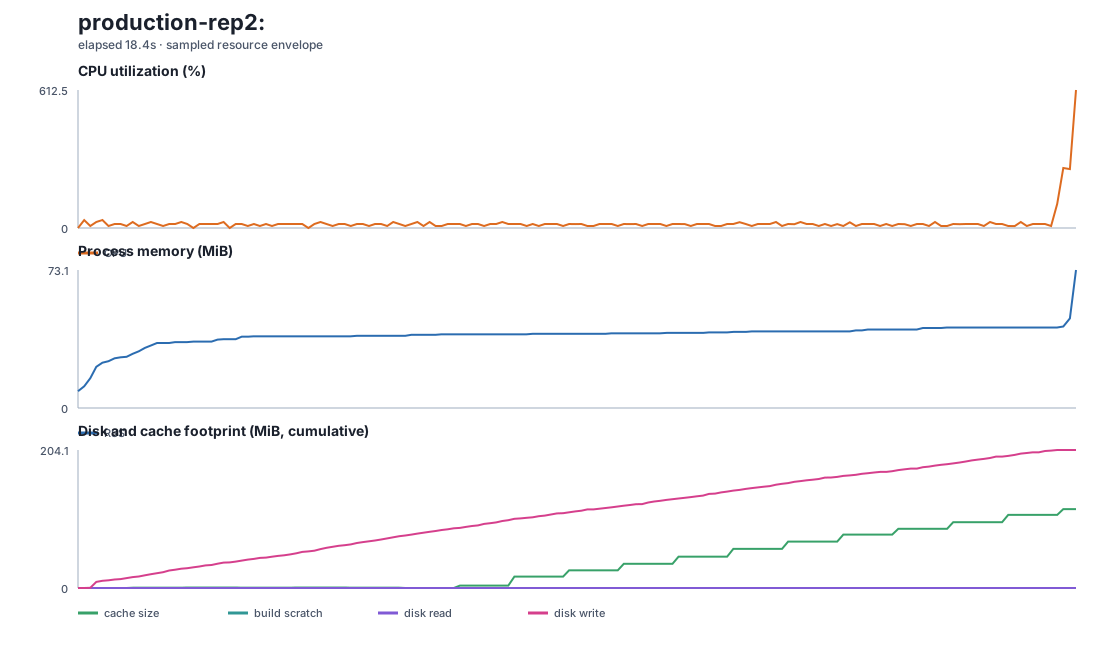
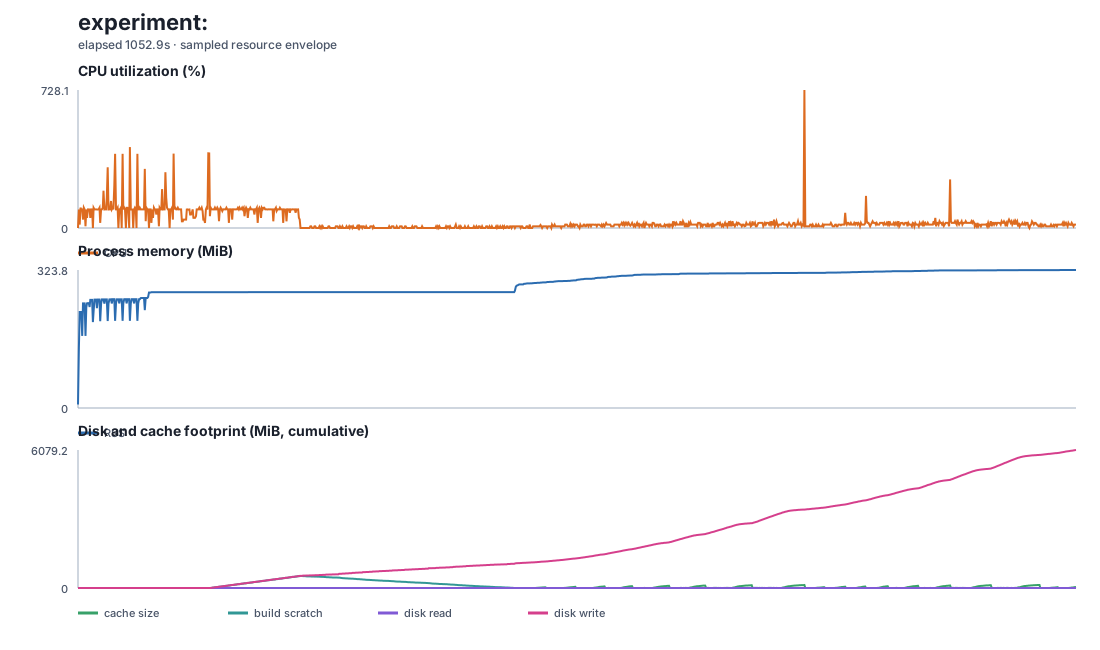
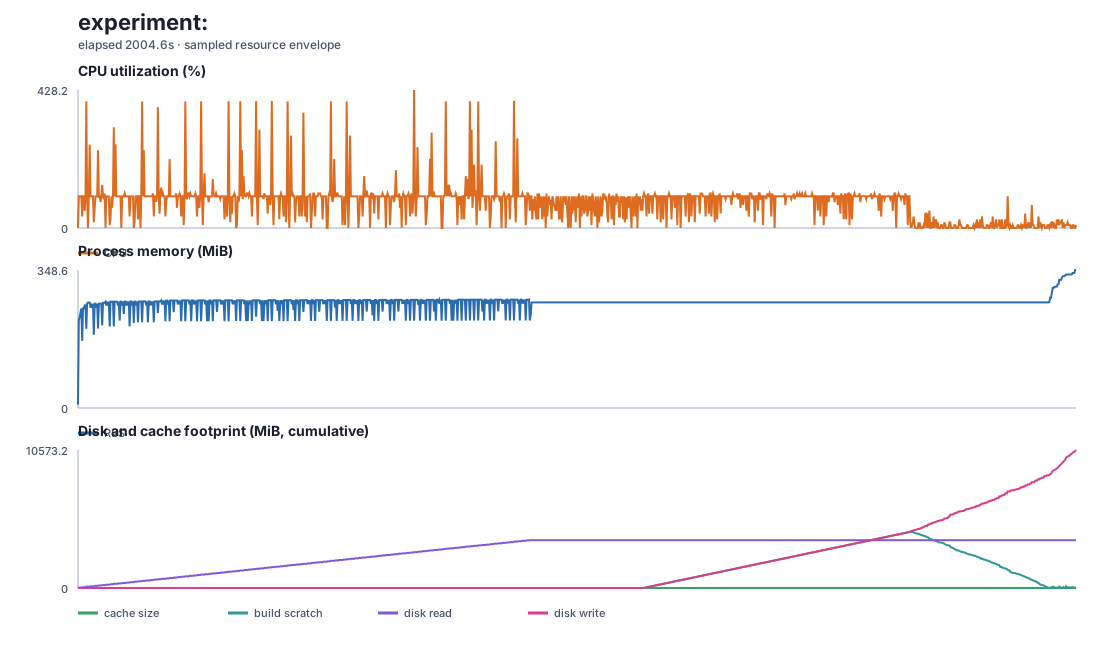
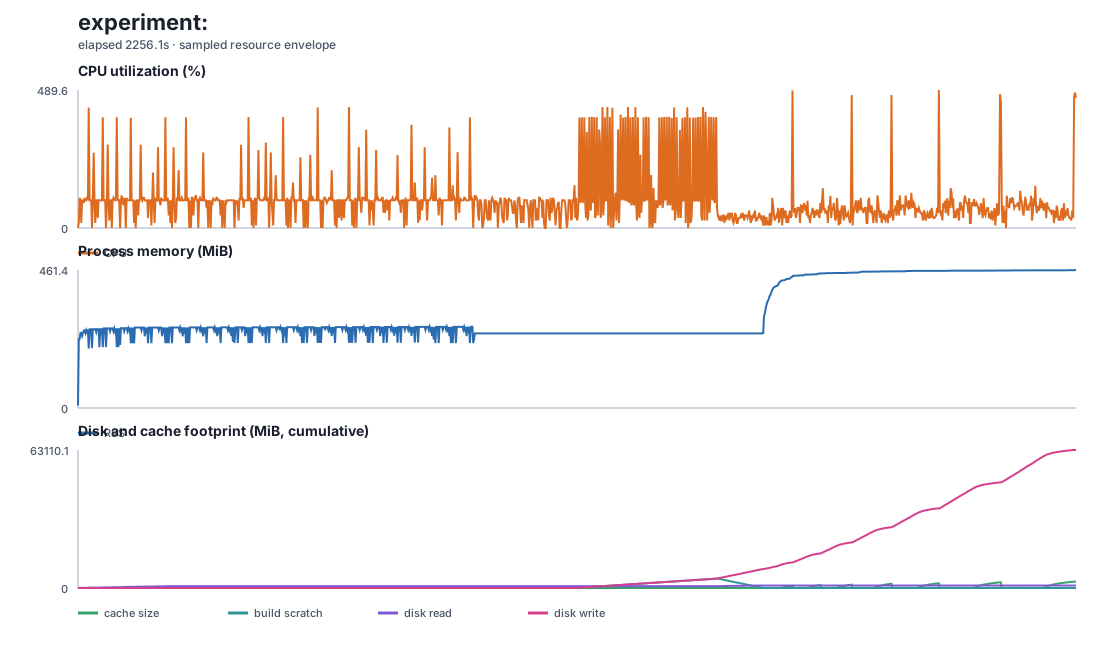
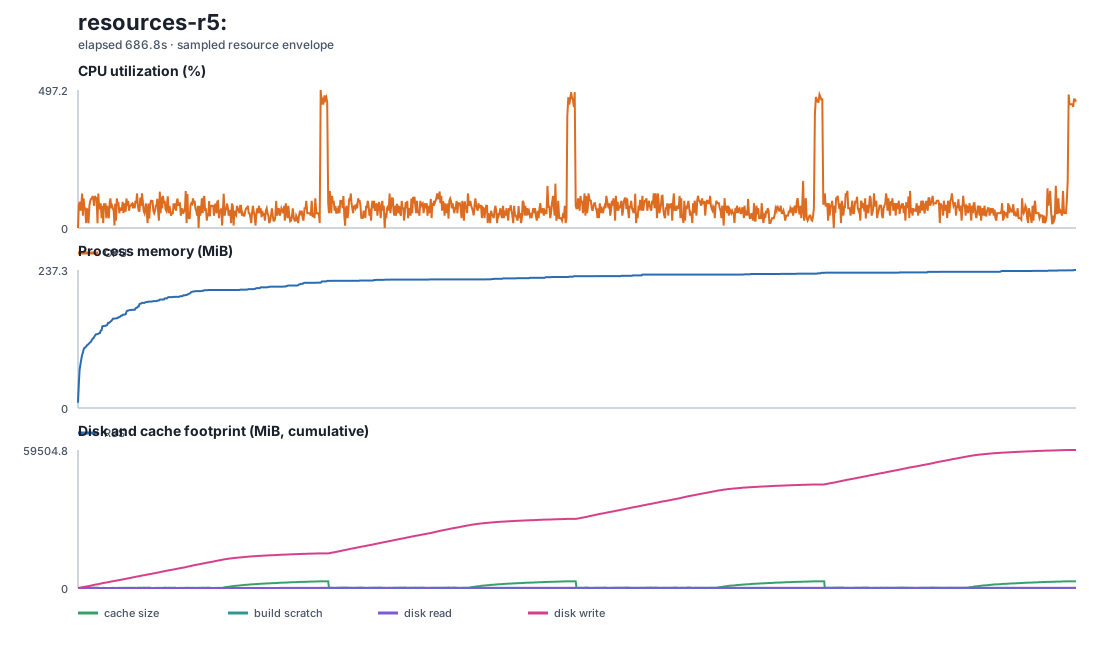
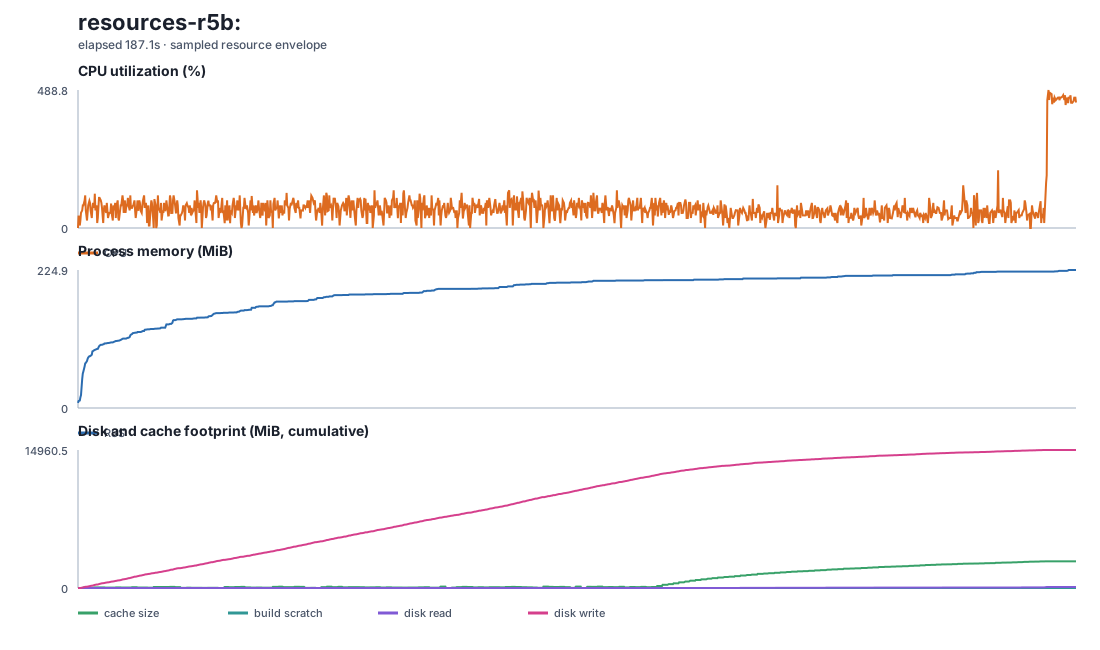
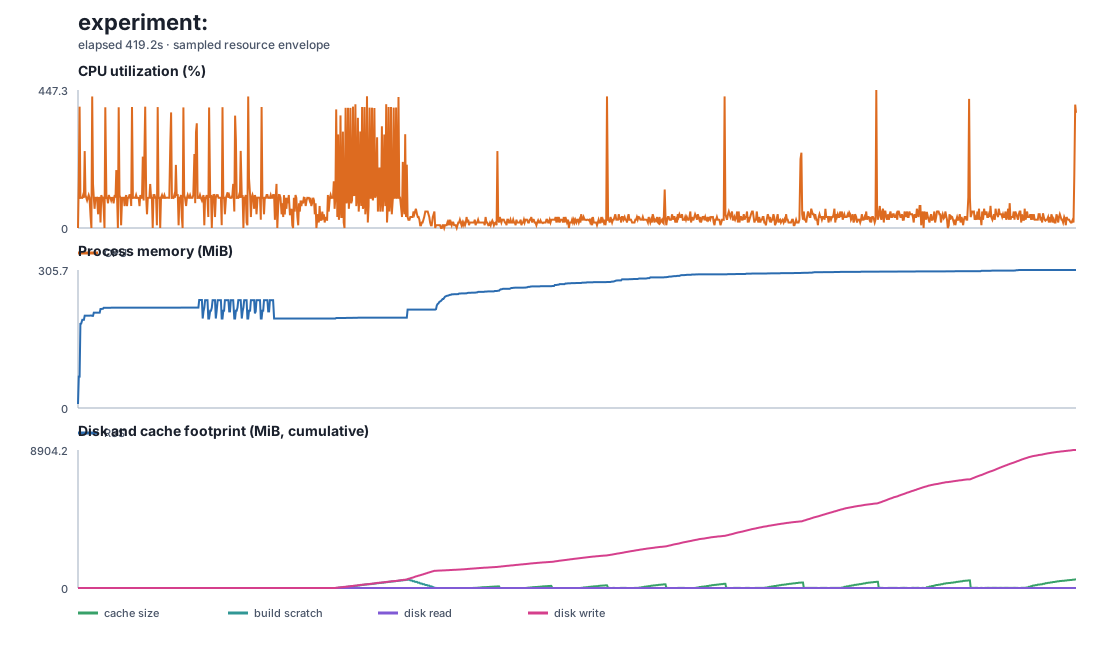
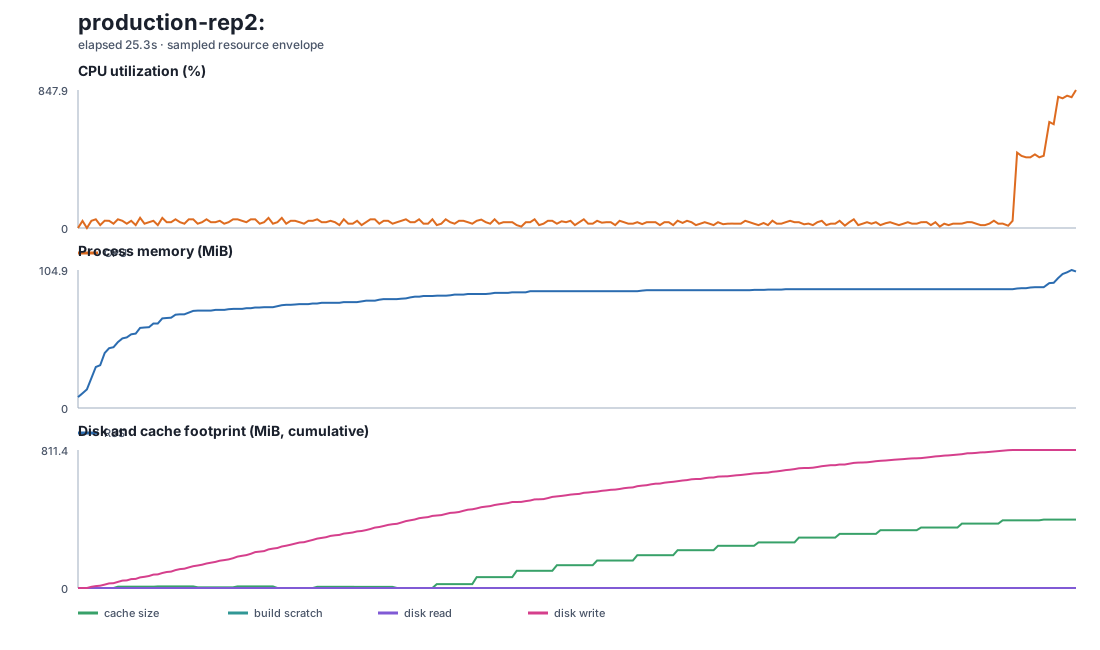
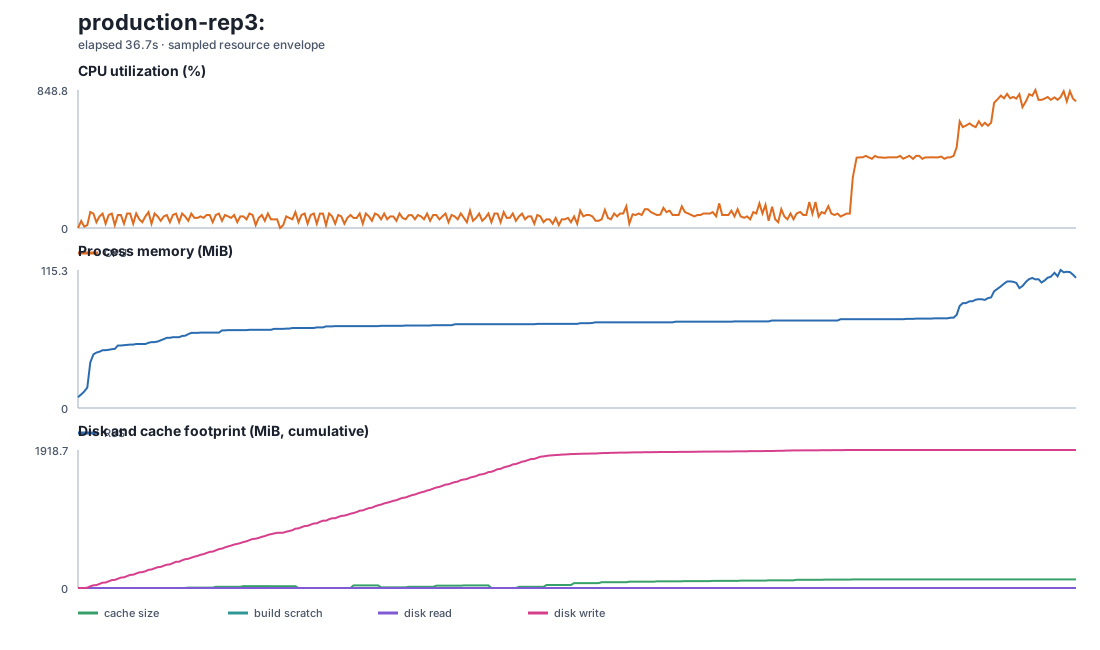
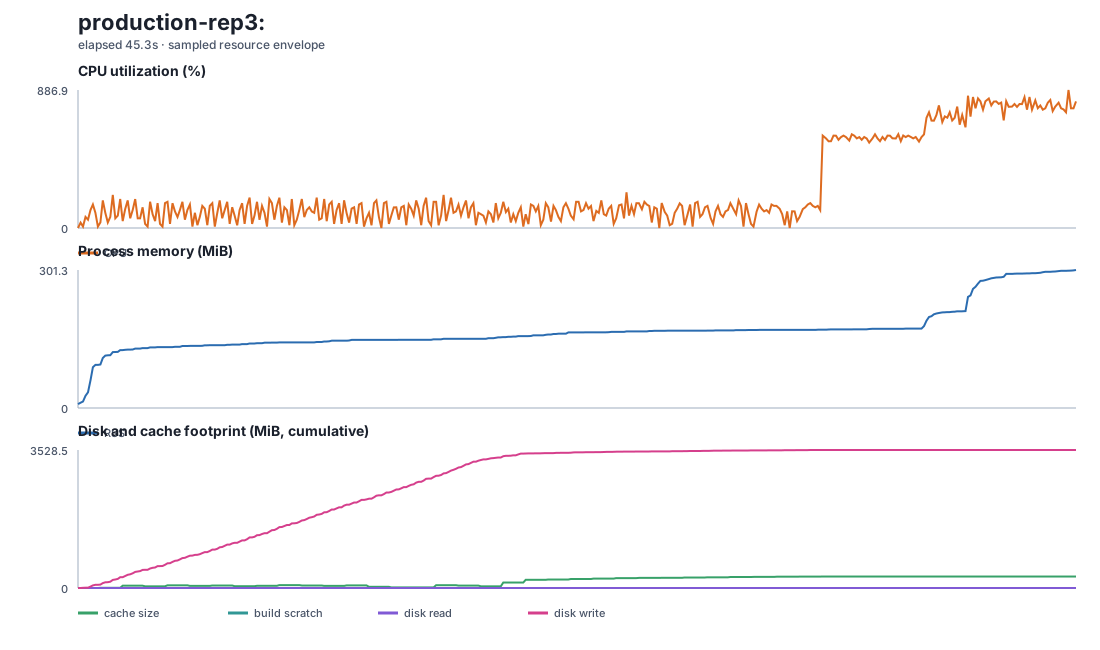
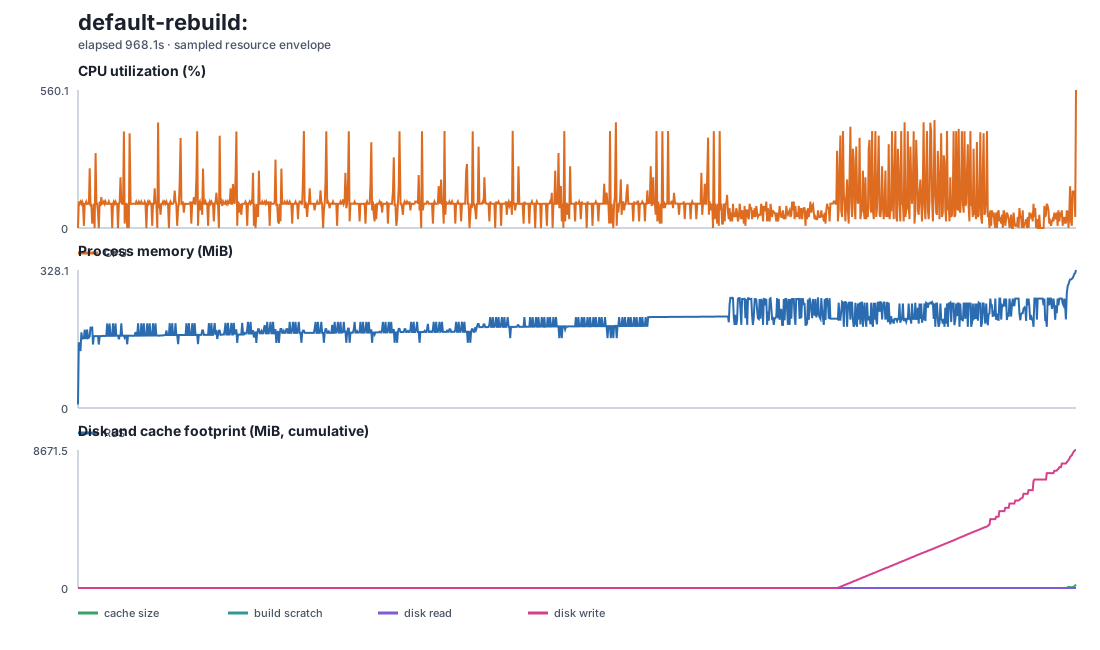
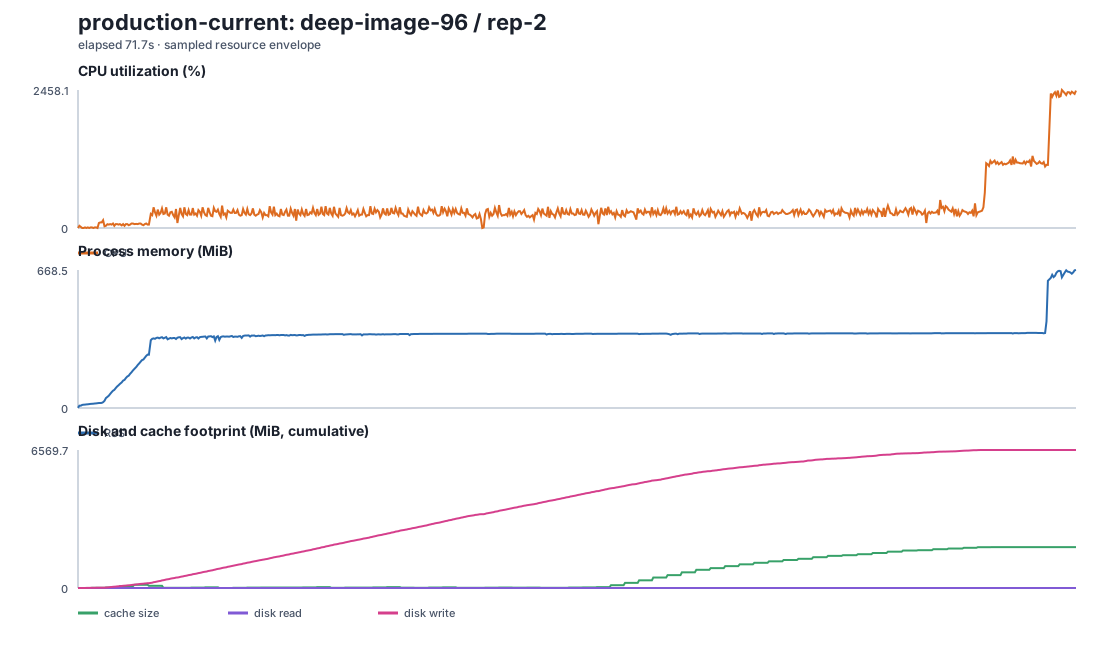
CPU, RAM, process disk, and cache growth
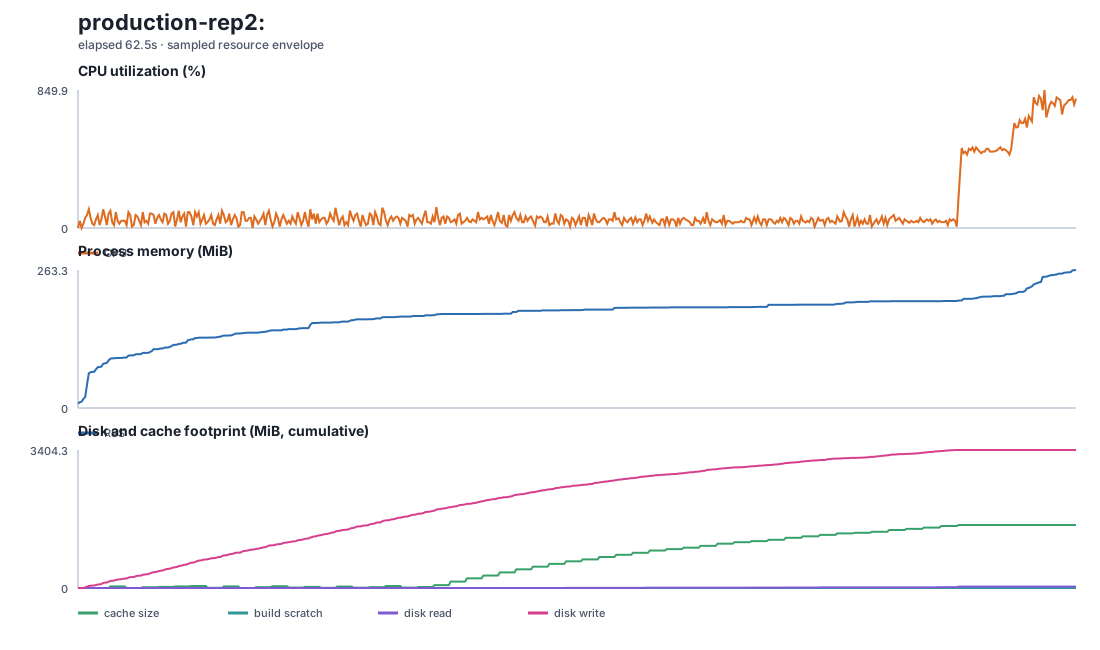
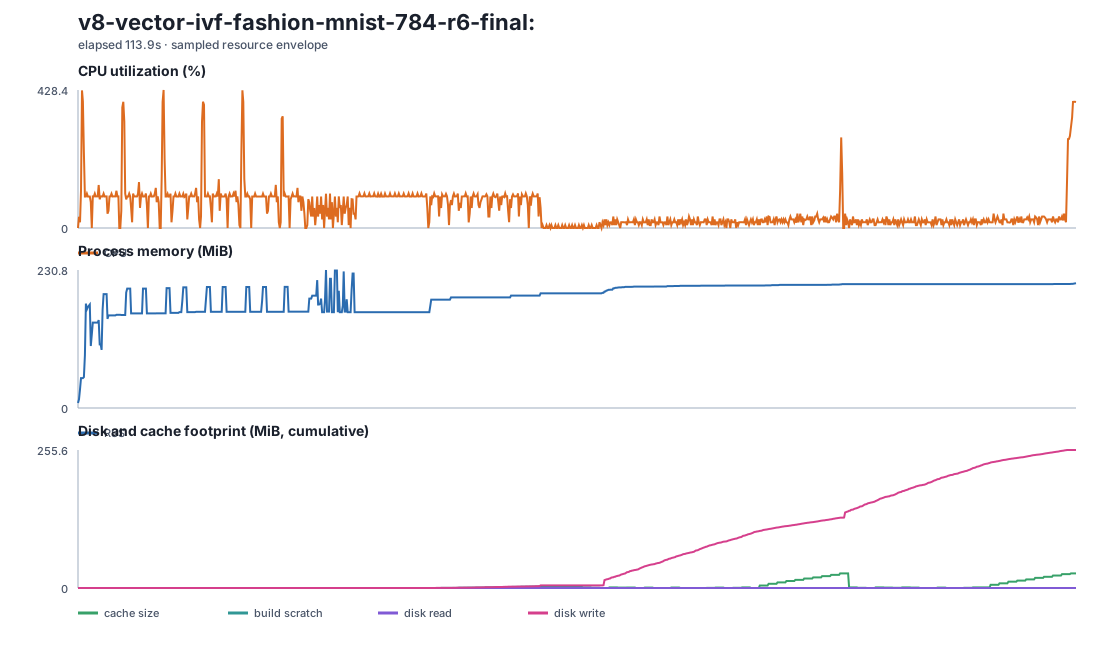
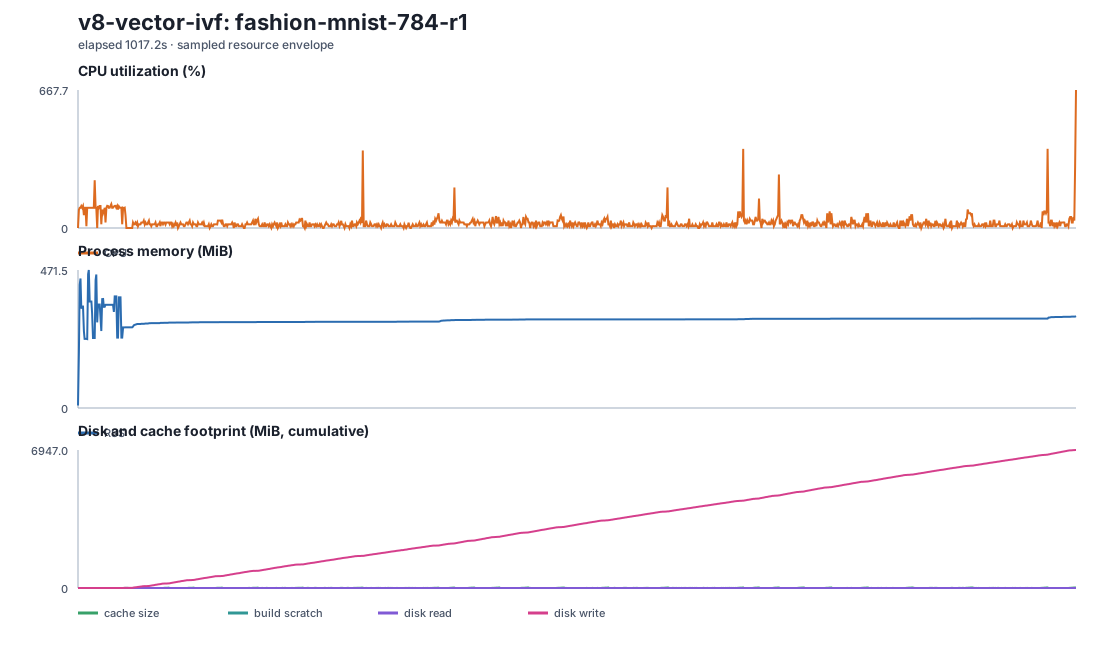
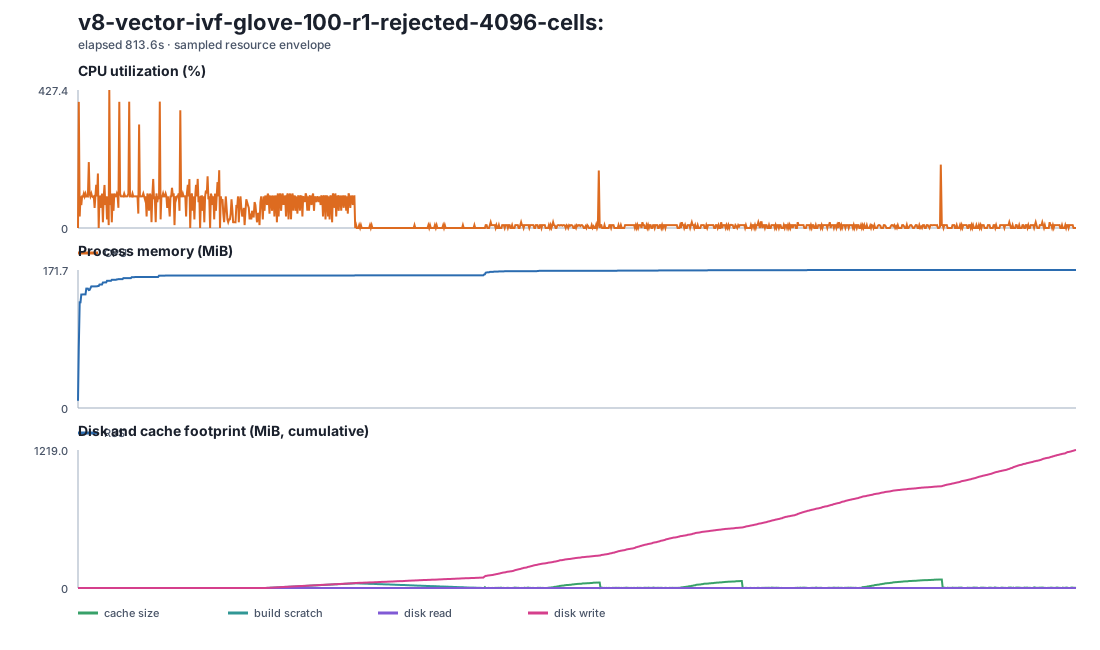
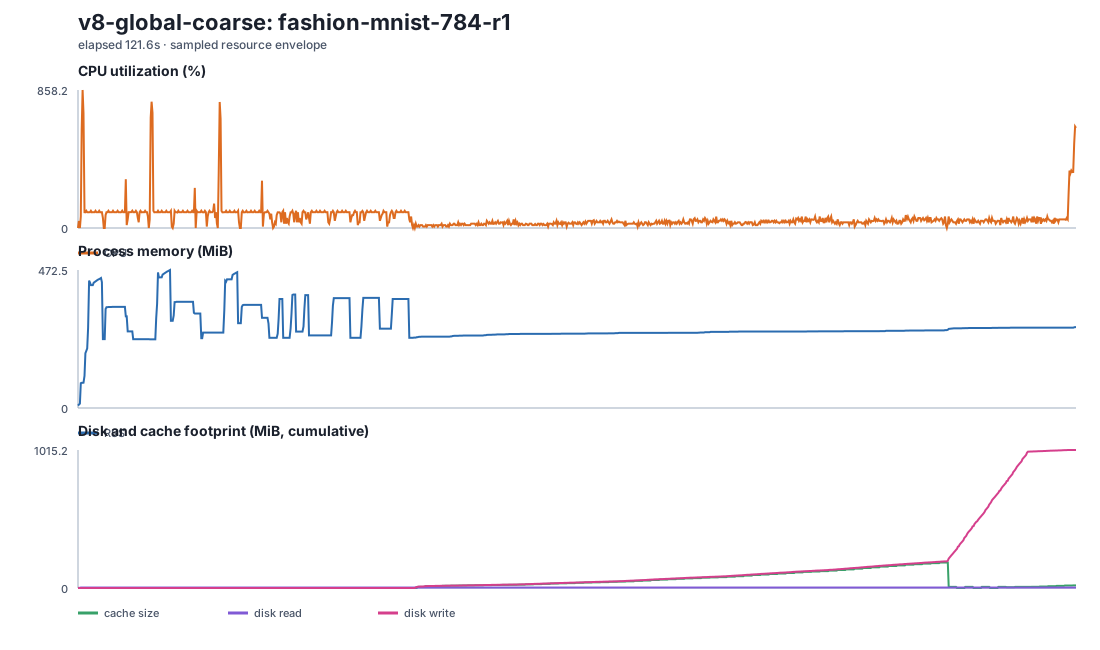
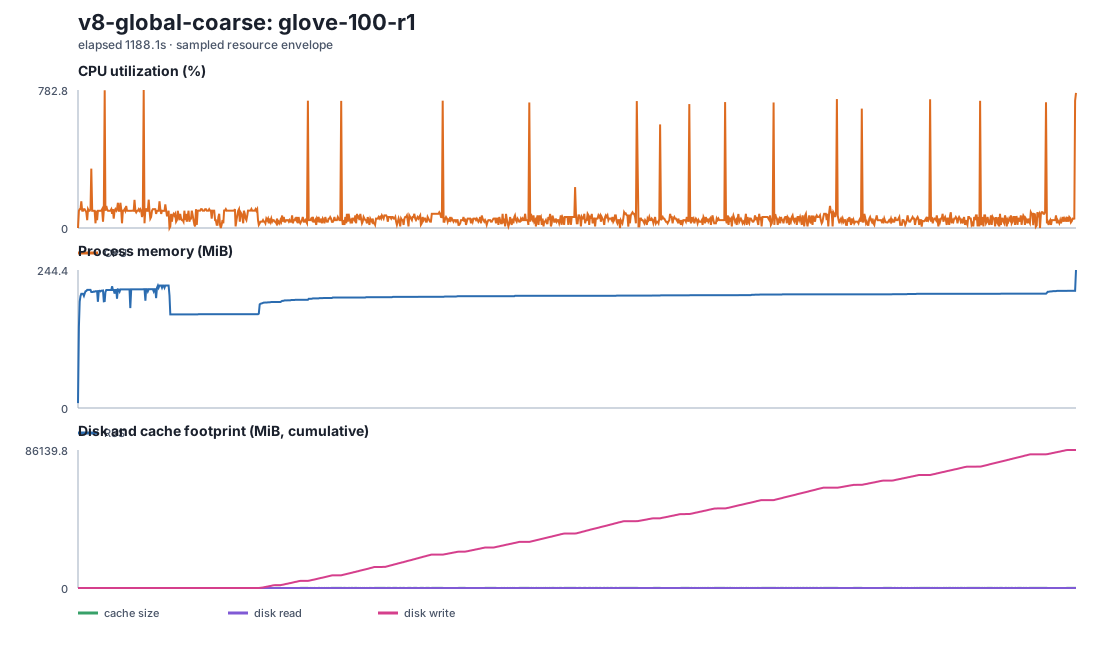
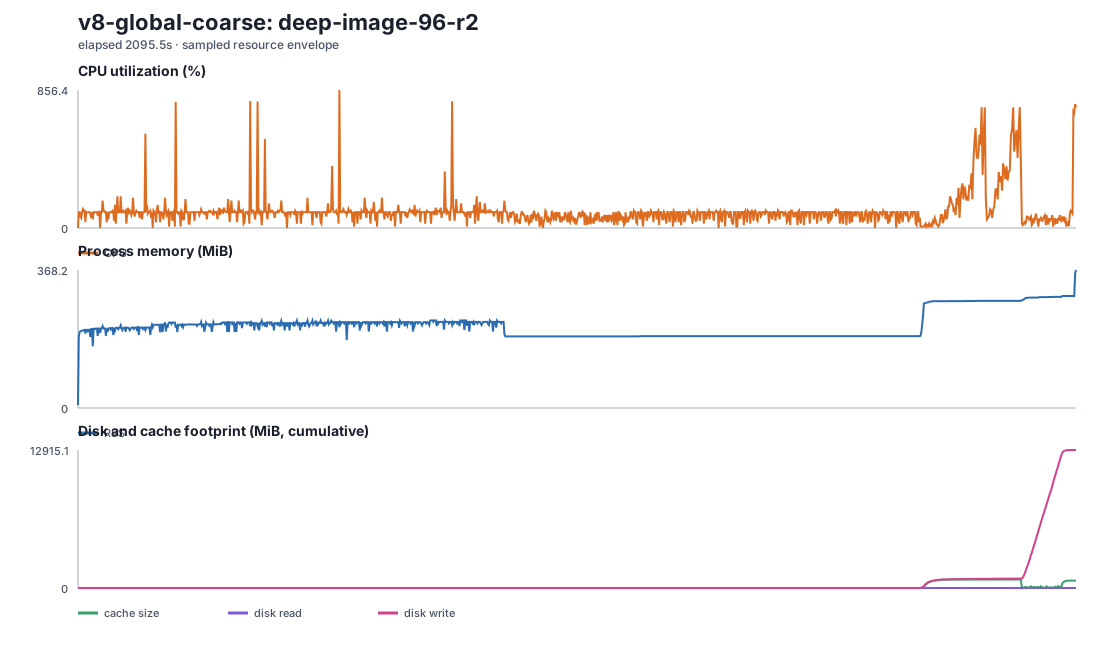
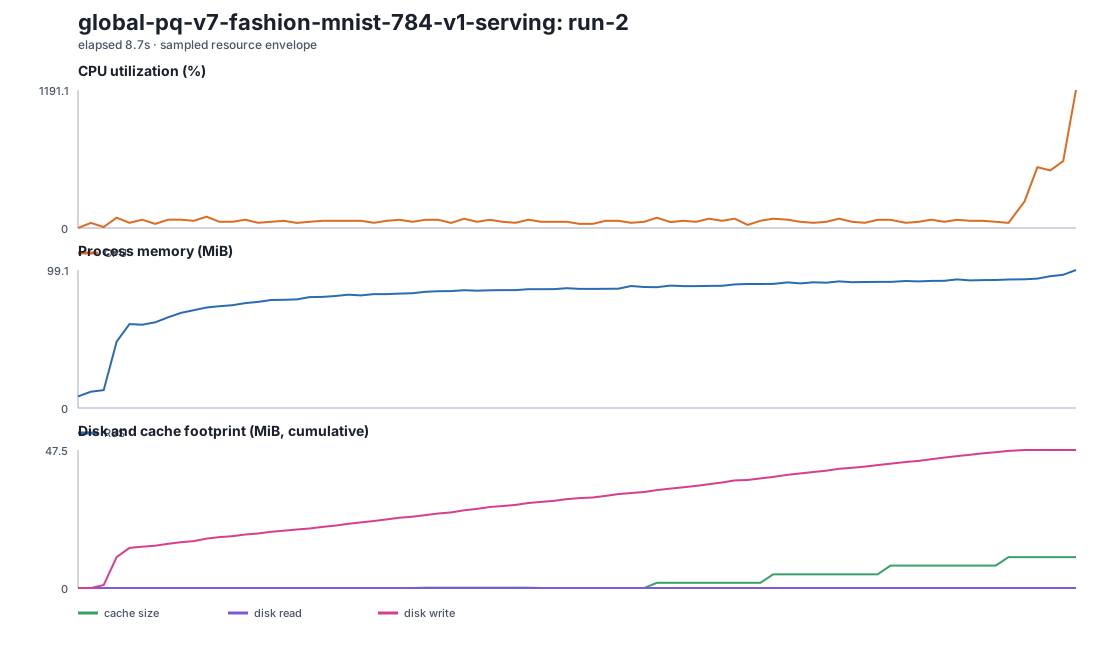
These production traces include the embedded engine, language/runtime overhead, query buffers, and cache—not just an artifact-size estimate. Uncapped multi-user traces remain a separate throughput-ceiling experiment. The v7 GloVe trace uses four admitted searches and the shared exact-rerank read gate.
Comparable economics
Do not charge only BORSUK for the client
Every system needs application/client compute. BORSUK runs search inside that process; S3 Vectors, turbopuffer, Pinecone, and Chroma receive the request from it and include remote search compute in their service price. The headline product rows therefore exclude common client compute for every system. BORSUK reports its selected S3 index storage and measured GETs, while CPU/RAM/disk stay explicit in the resource evidence above. See the dated cost formulas and current vendor list prices.
Leaf modes
Mode Evaluation
Measured with cargo run --locked --release -p borsuk --example benchmark_report on 10k and 100k synthetic vectors plus the scikit-learn digits CSV, using 100 queries per dataset. Datasets are bulk inserted, compacted into vector-local leaves, then queried. Synthetic datasets use 64 dimensions, max_segments=8, routing_page_overfetch=8, and max_candidates_per_segment=64. Recall charts use tie-aware recall, where a different id at the same exact kth distance is accepted; id recall and termination-reason counts remain visible in the data table. The benchmark CLI also accepts --max-segments, --routing-page-overfetch, and --max-candidates-per-segment for explicit recall/I/O probes. The report fails if pq-scan, vamana-pq, or hybrid falls below 0.95 tie-aware recall@10.
Routing lookahead
Overfetch vs Recall and I/O
The routing-overfetch sweep reruns the high-recall modes with routing_page_overfetch=1,2,4,8,16,32. Higher values allow extra cheap routing metadata when page bounds are tied or close. At each routing layer, overfetch also has a page-level floor, so sibling metadata pages can stay eligible even when the first dense page already contains enough leaf segments for the payload budget. Segment and graph payload budgets stay separate, so the chart shows recall safety without silently raising resident memory.
Filter-first ranking
Metadata sparsity vs work
Here a categorical tier is spread uniformly across every segment, so segment pruning cannot help — the filter simply rejects a growing share of the rows a query would rank. As rejection climbs 0 → 90%, the set of matching rows inside each segment gets small enough that BORSUK switches to filter-first ranking — it ranks the actual matches instead of ranking vector-nearest rows and dropping the non-matches. The result is that id recall@10 stays at 1.00 across the whole sweep while the rows exact-scored per query fall with the match count. Bytes read stay flat because every segment object is still fetched whole — the saving here is scoring work, not I/O.
Why the bump at 80%? It is the crossover, not a bug. Up to ~70% rejection a segment still holds more matches than the candidate budget, so the budgeted scan scores only the budget of vector-nearest rows (a capped subset). At ~80% the matches finally drop below the budget, so filter-first ranking kicks in and scores every match in each segment — briefly more scoring work, but now exact among the matches rather than a capped approximation. Past that point the match count keeps shrinking, so the work falls again. Recall is 1.00 throughout; the bump is BORSUK choosing exactness over a smaller cap once it can afford to. Regenerate with the ignored sparsity_sweep_gate.
More
Reproduce and extend
Each sweep has an ignored gate test that regenerates its CSV — see
the section copy for the exact test name. Full-corpus, method,
configuration, scale, comparison, and reproduction notes are in the
canonical
docs/research/
hierarchy. Raw artifacts remain under
docs/web/assets/benchmarks/.